
Marketing Insights for
Marketing Insights for
Marketing Insights for Ad Budget Decisions
Ad Budget Decisions
Ad Budget Decisions
See whether your ads make real profit, whether new customers pay back, and whether to scale, hold or cut.
See whether your ads make real profit, whether new customers pay back,
and whether to scale, hold or cut.
See whether your ads make real profit, whether new customers pay back, and whether to scale, hold or cut.


CAC payback curve
ACTUAL
11 new customers
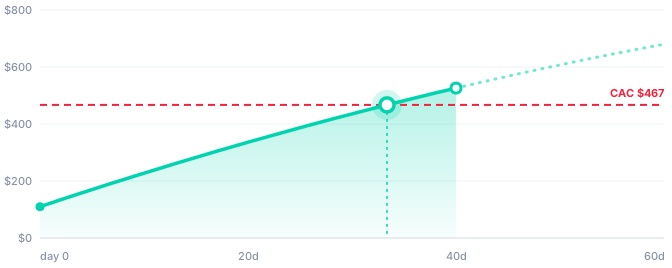
Cumulative profit
Acquisition cost
Break-even · day 33
BUDGET ADVICE
GROW
$85/day
from $81/day, one small step
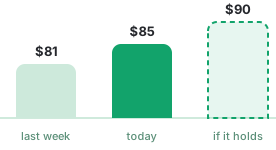
↗ holds: $90
↘ slips: $81
ROAS vs breakeven
Pass
4.1x

Breakeven ROAS 3.3x
Marginal ROAS
Pass
3.6x

Next dollar returns
Customers pay back
Pass
41 days

LTV:CAC 1.4 · 60-day
CAC payback curve
ACTUAL
11 new customers
Cumulative profit
Acquisition cost
Break-even · day 33
BUDGET ADVICE
GROW
$85/day
from $81/day, one small step
↗ holds: $90
↘ slips: $81
ROAS vs breakeven
Pass
4.1x
Breakeven ROAS 3.3x
Marginal ROAS
Pass
3.6x
Next dollar returns
Customers pay back
Pass
41 days
LTV:CAC 1.4 · 60-day
A Higher ROAS Doesn’t Always Mean More Budget
A Higher ROAS Doesn’t Always Mean More Budget
A Higher ROAS Doesn’t Always Mean More Budget
Your ROAS goes up, so you raise spend. Here’s what ROAS doesn’t show you.
Your ROAS goes up, so you raise spend. Here’s what ROAS doesn’t show you.
Ad revenue → what you keep
Revenue from ads
$41,000
Product costs
−$18,500
Shipping & handling
−$7,400
Payment fees
−$2,800
Kept before ad spend
$12,300
Revenue Isn’t Profit

Tap to see why
01 // REVENUE ISN’T PROFIT
Costs come first
Product costs, shipping and payment fees take their share before anything reaches your bank.

Flip back
Return on the next dollar
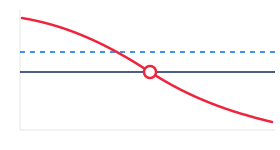
Average ROAS 4.1x
Breakeven 3.3x
Ceiling
Average ROAS 4.1x
Breakeven 3.3x
Ceiling
Ad spend →
Averages Hide the Ceiling
Tap to see why
02 // AVERAGES HIDE THE CEILING
Each dollar earns less
Every extra dollar reaches shoppers who are less likely to buy. Your average ROAS can’t show where that starts.
Flip back
New customers, 60 days later
Bought once
78%
Bought again
22%
Cost to acquire
$48
60-day profit
$31
LTV:CAC
0.6
Good Ads Can Buy Bad Customers
Tap to see why
03 // GOOD ADS CAN BUY BAD CUSTOMERS
One order isn’t payback
If new customers don’t reorder, you never earn back what you paid to acquire them.
Flip back
Ad revenue → what you keep
Revenue from ads
$41,000
Product costs
−$18,500
Shipping & handling
−$7,400
Payment fees
−$2,800
Kept before ad spend
$12,300
Revenue Isn’t Profit
Tap to see why
01 // REVENUE ISN’T PROFIT
Costs come first
Product costs, shipping and payment fees take their share before anything reaches your bank.
Flip back
Return on the next dollar
Average ROAS 4.1x
Breakeven 3.3x
Ceiling
Ad spend →
Averages Hide the Ceiling
Tap to see why
02 // AVERAGES HIDE THE CEILING
Each dollar earns less
Every extra dollar reaches shoppers who are less likely to buy. Your average ROAS can’t show where that starts.
Flip back
New customers, 60 days later
Bought once
78%
Bought again
22%
Cost to acquire
$48
60-day profit
$31
LTV:CAC
0.6
Good Ads Can Buy Bad Customers
Tap to see why
03 // GOOD ADS CAN BUY BAD CUSTOMERS
One order isn’t payback
If new customers don’t reorder, you never earn back what you paid to acquire them.
Flip back
Find the Illusion Gap Between ROAS and POAS
Find the Illusion Gap Between ROAS and POAS
Find the Illusion Gap Between ROAS and POAS
ROAS counts revenue. POAS (profit on ad spend) counts what you keep after product, shipping, handling and payment costs. The gap is revenue that never turns into profit.
ROAS counts revenue. POAS (profit on ad spend) counts what you keep after product, shipping, handling and payment costs. The gap is revenue that never turns into profit.
Drag the sliders to find your illusion gap.
Ad spend
$10k
$1k
$50k
Revenue from ads
$41k
$5k
$200k
Costs as % of revenue
70%
10%
90%
ROAS
4.1x
Revenue ÷ ad spend
POAS
1.2x
Revenue after costs ÷ ad spend
Breakeven ROAS
3.3x
1 ÷ (1 − cost %)
Above breakeven
These ads make money after costs.
Revenue from ads
$41k
Kept after costs

Illusion gap: 70% of revenue goes to costs
Illusion gap: 70% of revenue goes to costs
$12.3k
Ad spend
$10k
Your ROAS against breakeven ROAS
8x
Breakeven 3.3x
ROAS 4.1x
Marketing Insights runs this math on your real orders and costs, every week.
Drag the sliders to find your illusion gap.
Ad spend
$10k
$1k
$50k
Revenue from ads
$41k
$5k
$200k
Costs as % of revenue
70%
10%
90%
ROAS
4.1x
Revenue ÷ ad spend
POAS
1.2x
Revenue after costs ÷ ad spend
Breakeven ROAS
3.3x
1 ÷ (1 − cost %)
Above breakeven
These ads make money after costs.
Revenue from ads
$41k
Kept after costs
Illusion gap: 70% of revenue goes to costs
$12.3k
Ad spend
$10k
Your ROAS against breakeven ROAS
8x
Breakeven 3.3x
ROAS 4.1x
Marketing Insights runs this math on your real orders and costs, every week.
Scale only when you’re profitable
Scale only when you’re profitable
Scale only when you’re profitable
Bloom only tells you to scale after it verifies your ad costs, your room to grow and your customer returns.
Bloom only tells you to scale after it verifies your ad costs, your room to grow and your customer returns.
Scale check · Last 30 days
Example store
1

Profitable today
Passed
If not:
Reduce spend
2
Room to grow
Passed
3
Customers pay back
Passed
4
Your signal
Can scale
01 //
Profitable Today
02 //
Room to Grow
03 //
Customer Payback
04 //
Your Signal
Profitable today
Are your ads making money right now, after your real costs? Bloom checks before anything else.
Room to grow
Will more budget keep paying back? Bloom looks past your average return to what extra spend is likely to earn.
Customers pay back
Are the customers you’re buying worth what they cost? Bloom checks their real value over time, not just the first order.
Your signal
When everything checks out, you’ll see
Can scale
When something doesn’t, Bloom tells you whether to hold, fix or cut, and why.
Read It in Minutes, Act on It the Same Day
Read It in Minutes, Act on It the Same Day
Click a pin to see how Bloom tells you what to do next.
Click a pin to see how Bloom tells you what to do next.
Scale Decision
Last 30 days

ROAS target 3.5x · You’re at 4.1x
POAS

1.2x
Breakeven ROAS
3.3x
Payback
41 days
Alerts
Meta · Prospecting
Working. ROAS above breakeven.
TikTok · Retargeting
Watch. Marginal ROAS is falling.
Google · Shopping
Fix now. ROAS 2.6x, under breakeven.
Next step: lower the daily budget until ROAS clears 3.3x.
ROAS vs breakeven

Show Insight
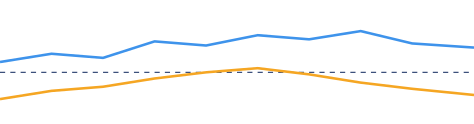
Breakeven 3.3x
Breakeven 3.3x

Insight
Your ROAS has stayed above breakeven for 4 weeks, but marginal ROAS is falling. Raise spend in small steps and check the gates next week.




POAS (profit on ad spend): what you keep after product, shipping, handling and payment costs, ÷ ad spend.
1
2
3
4
1
Alerts with next steps
Green means it’s working, red means fix this now, and amber means watch it. Each red alert comes with a specific next step.
2
Show Insight
A plain-English read on every chart, so you never have to interpret the numbers yourself.
3
Your ROAS target
Set it once. You’ll see a green check when you’re above it, or the exact gap when you’re not.
4
Hover definitions
Point at any metric to see what it means, so POAS and payback are never a guess.
Scale Decision
Last 30 days
ROAS target 3.5x · You’re at 4.1x
POAS
1.2x
Breakeven ROAS
3.3x
Payback
41 days
Alerts
Meta · Prospecting
Working. ROAS above breakeven.
TikTok · Retargeting
Watch. Marginal ROAS is falling.
Google · Shopping
Fix now. ROAS 2.6x, under breakeven.
Next step: lower the daily budget until ROAS clears 3.3x.
ROAS vs breakeven
Show Insight
Breakeven 3.3x
Insight
Your ROAS has stayed above breakeven for 4 weeks, but marginal ROAS is falling. Raise spend in small steps and check the gates next week.
POAS (profit on ad spend): what you keep after product, shipping, handling and payment costs, ÷ ad spend.
1
2
3
4
1
Alerts with next steps
Green means it’s working, red means fix this now, and amber means watch it. Each red alert comes with a specific next step.
2
Show Insight
A plain-English read on every chart, so you never have to interpret the numbers yourself.
3
Your ROAS target
Set it once. You’ll see a green check when you’re above it, or the exact gap when you’re not.
4
Hover definitions
Point at any metric to see what it means, so POAS and payback are never a guess.
Built for Whoever Signs Off on the Ad Budget
Built for Whoever Signs Off on the Ad Budget
Built for Whoever Signs Off on the Ad Budget
One line on why each role needs a profit signal, not platform ROAS]
One line on why each role needs a profit signal, not platform ROAS]
This week’s signal
Hold steady
Profitable today · ROAS 4.1x vs 3.3x

Next dollar · Marginal ROAS 3.1x, under 3.3x
–
Customers pay back · checked after gate 2
Gate that drove it
Gate 2 · Next dollar
Ad profit report · September
For leadership
POAS
1.2x
Payback
41 days
New customer ROAS
2.6x
Platform ROAS
4.1x
Payback days · new customers
41 days
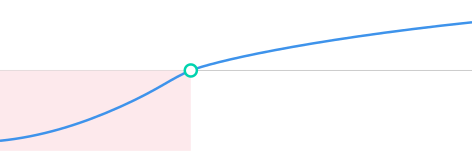
Cash tied up: −$48 per customer
Earned back on day 41
$0
Cash tied up: −$48 per customer
Earned back on day 41
$0
01 //
Founders
02 //
Performance Marketers
03 //
Finance Leads
Decide on spend with a reason behind it
Get a clear scale, hold or cut signal each week, along with the gate that drove it.
Report profit, not platform ROAS
Show leadership POAS, payback days and new customer returns instead of an Ads Manager screenshot.
See the cash your ads tie up
Payback days show how long each new customer holds your cash before they earn it back.
This week’s signal
Hold steady
Profitable today · ROAS 4.1x vs 3.3x
Next dollar · Marginal ROAS 3.1x, under 3.3x
–
Customers pay back · checked after gate 2
Gate that drove it
Gate 2 · Next dollar
Ad profit report · September
For leadership
POAS
1.2x
Payback
41 days
New customer ROAS
2.6x
Platform ROAS
4.1x
Payback days · new customers
41 days
Cash tied up: −$48 per customer
Earned back on day 41
$0
01 //
Founders
02 //
Performance Marketers
03 //
Finance Leads
Decide on spend with a reason behind it
Get a clear scale, hold or cut signal each week, along with the gate that drove it.
Report profit, not platform ROAS
Show leadership POAS, payback days and new customer returns instead of an Ads Manager screenshot.
See the cash your ads tie up
Payback days show how long each new customer holds your cash before they earn it back.
What Merchants Say
What Merchants Say
What Merchants Say

Bruns
Sweden
Great app! Very interactive UI. Gives you full insight in product data, customer behaviours/AOV, shipping costs and much more. I will certainly use this. Great support that answers quickly and is very helpful!
Bruns
Sweden
Great app! Very interactive UI. Gives you full insight in product data, customer behaviours/AOV, shipping costs and much more. I will certainly use this. Great support that answers quickly and is very helpful!

muk mat
Australia
I really like this app so far. There were some formula changes I wanted to make to align with our internal KPI metrics, the team accommodated those changes without any issues and quickly.
muk mat
Australia
I really like this app so far. There were some formula changes I wanted to make to align with our internal KPI metrics, the team accommodated those changes without any issues and quickly.

Manchester Warehouse
Australia
We have only started using this App and it's proved to be a game changer. We are only a small business and struggled to have proper Dashboard reporting where everything can be seen in one place.
Manchester Warehouse
Australia
We have only started using this App and it's proved to be a game changer. We are only a small business and struggled to have proper Dashboard reporting where everything can be seen in one place.
Manchester Warehouse
Australia
We have only started using this App and it's proved to be a game changer. We are only a small business and struggled to have proper Dashboard reporting where everything can be seen in one place.

Goal Zero
United States
We tried a few different profit analytics apps before landing on Bloom, and they were the only ones flexible enough to handle our shipping, handling, and fulfillment cost setup.
Goal Zero
United States
We tried a few different profit analytics apps before landing on Bloom, and they were the only ones flexible enough to handle our shipping, handling, and fulfillment cost setup.
Novaline Verzwaringsdekens
Netherlands
Amazing app to get more insight into your finances. Very detailed on different levels. And it has really nice integration with all marketing platforms (meta, google, reddit, etc.)
Novaline Verzwaringsdekens
Netherlands
Amazing app to get more insight into your finances. Very detailed on different levels. And it has really nice integration with all marketing platforms (meta, google, reddit, etc.)

ForeverLily
Germany
"This app basically gives you everything you need to know about your finances. The customer support is also amazing, helping fast and professional. I highly recommend it!"
ForeverLily
Germany
"This app basically gives you everything you need to know about your finances. The customer support is also amazing, helping fast and professional. I highly recommend it!"
ForeverLily
Germany
"This app basically gives you everything you need to know about your finances. The customer support is also amazing, helping fast and professional. I highly recommend it!"

kicksshop
Netherlands
I've been looking for a tool like this for years. It provides clear insights, which is incredibly valuable for your webshop. We now know exactly what we make from every sale. Thanks John and your team !!!
kicksshop
Netherlands
I've been looking for a tool like this for years. It provides clear insights, which is incredibly valuable for your webshop. We now know exactly what we make from every sale. Thanks John and your team !!!
kicksshop
Netherlands
I've been looking for a tool like this for years. It provides clear insights, which is incredibly valuable for your webshop. We now know exactly what we make from every sale. Thanks John and your team !!!

äktiivwear.co
United States
Must-Have for Profit Tracking & Growth! Bloom Analytics has been a game-changer for my Shopify store. It gives me real-time, accurate insights into my sales, profit margins, and ad performance in one place.
äktiivwear.co
United States
Must-Have for Profit Tracking & Growth! Bloom Analytics has been a game-changer for my Shopify store. It gives me real-time, accurate insights into my sales, profit margins, and ad performance in one place.

World Rugby Shop
United States
Bloom has been a great tool for real time analytics of our shopify store performance. The staff is very responsive and helpful when I have questions or feedback on the product. Very useful addition to our store!

DYLN
United States
So far I am loving the Bloom app! We migrated from Lifetimely, and it is comparable, but a way better value. I am recommending this app to everyone with a Shopify store, it's a no brainer.
DYLN
United States
So far I am loving the Bloom app! We migrated from Lifetimely, and it is comparable, but a way better value. I am recommending this app to everyone with a Shopify store, it's a no brainer.

Good-Lite Co
United States
Bloom has been a great addition to our Good-Lite workflow. It has helped us consolidate our reporting in one place, making it much easier to track performance, review key data, and keep everything organized

Stoked&Woke Clothing
Austria
"Huge thanks to the Bloom team for the support along the way. If you're looking for real clarity on your costs and profit, we can't recommend them enough. "
Stoked&Woke Clothing
Austria
"Huge thanks to the Bloom team for the support along the way. If you're looking for real clarity on your costs and profit, we can't recommend them enough. "

ZZGames.dk
Denmark
The support team is super great. The tool itself is great - it covers all key integrations and covers the full cost profile of your business to ensure you are tracking TRUE profit. 10/10.
ZZGames.dk
Denmark
The support team is super great. The tool itself is great - it covers all key integrations and covers the full cost profile of your business to ensure you are tracking TRUE profit. 10/10.

OMOYÉ
France
Must-have tool, yet at a very affordable price. It gives you all the financial numbers and insights you need to help improve profitability, that would be very difficult to produce manually.

MedShop Direct
United States
"Love the app, and Ziyan from Customer Support was super helpful. John the founder is also very responsive! The dashboard is easy to use and provides a full picture. Thanks!"
MedShop Direct
United States
"Love the app, and Ziyan from Customer Support was super helpful. John the founder is also very responsive! The dashboard is easy to use and provides a full picture. Thanks!"

Baron Barclay Bridge Supply
United States
Bloom Analytics is a game-changer! It gives me all the insights I need - revenue, profit, and top-performing products without the headache. Clean, simple, and way more intuitive than other tools. I highly recommend it!
Baron Barclay Bridge Supply
United States
Bloom Analytics is a game-changer! It gives me all the insights I need - revenue, profit, and top-performing products without the headache. Clean, simple, and way more intuitive than other tools. I highly recommend it!
Spend More Only When Your Ads Pay You Back
Connect your store and see your POAS, breakeven ROAS and scale signal in one place.

Spend More Only When Your Ads Pay You Back
Connect your store and see your POAS, breakeven ROAS and scale signal in one place.
Spend More Only When Your Ads Pay You Back
Connect your store and see your POAS, breakeven ROAS and scale signal in one place.