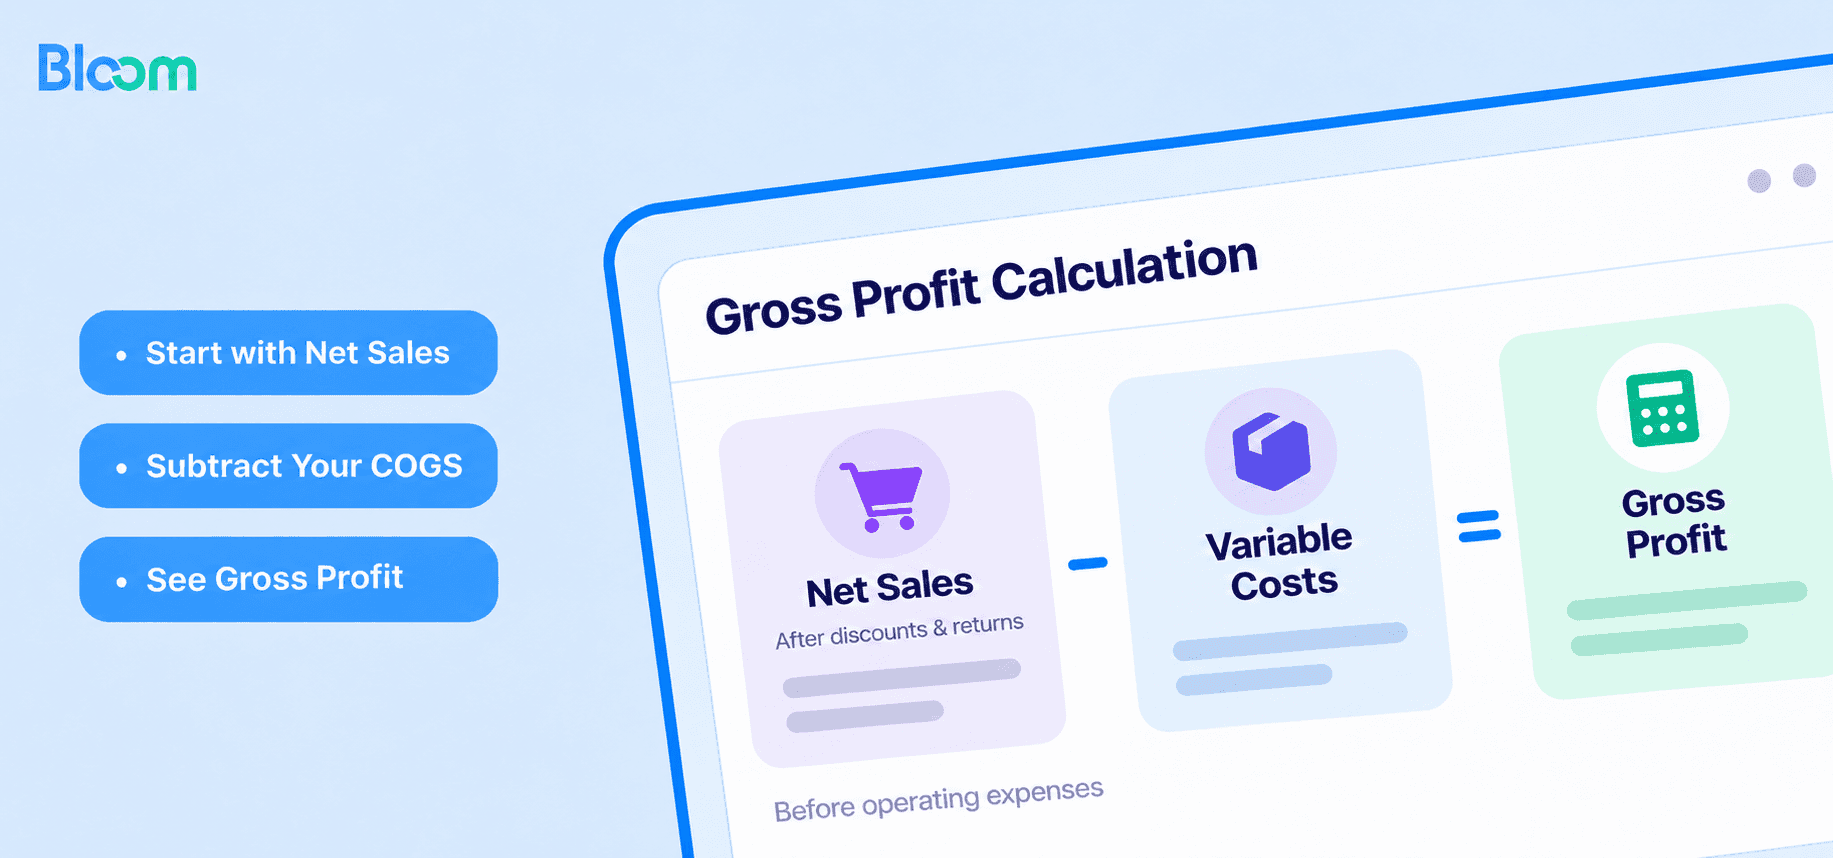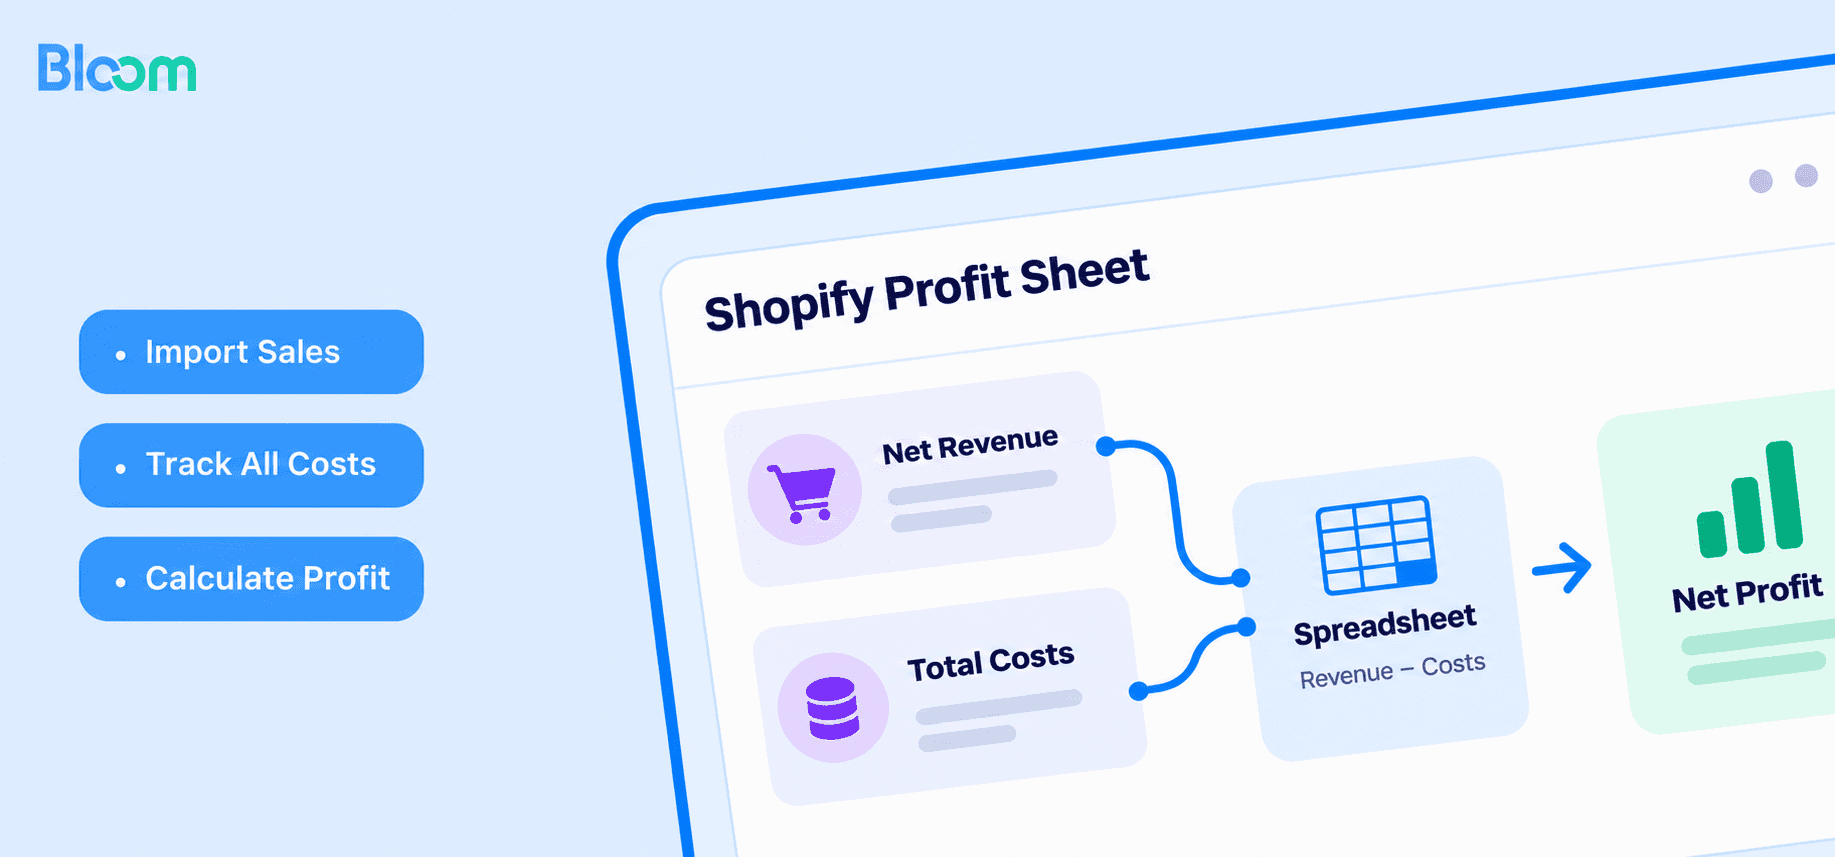



To calculate Shopify profit using a spreadsheet, subtract your total costs (COGS, Shopify fees, ad spend, fulfillment, and operating expenses) from your net sales inside Excel or Google Sheets. A Shopify profit spreadsheet gives you one place to record revenue, apply formulas, and see your real net profit margin, instead of staring at Shopify’s gross sales number and guessing.
Most Shopify store owners confuse revenue with Shopify profit. A store can clear $50,000 in sales and still take home almost nothing once product costs, transaction fees, and ads are deducted. A properly built Shopify spreadsheet makes that gap visible and forces honest numbers.
This guide walks through the exact structure of a Shopify profit spreadsheet, the formulas that power it, the components you cannot forget, and the common mistakes that quietly destroy accuracy. By the end, you will have a reusable Shopify spreadsheet you can run every month.
Key takeaways
Shopify profit = Net sales − COGS − Shopify fees − Ads − Fulfillment − Operating expenses. Revenue is not profit.
A Shopify profit spreadsheet should be built in layered profit tiers (gross profit, contribution margin, net profit), not one flat column.
Use SUM, IF, and SUMIF formulas to automate the Shopify spreadsheet so you update inputs, not math.
Reconcile the Shopify spreadsheet against Shopify payouts and ad platform invoices monthly or your Shopify profit numbers drift.
A Shopify spreadsheet is the right tool for up to a few hundred orders a month; beyond that, automated profit tools pay for themselves.
What counts as Shopify profit?
Shopify profit is the money your store keeps after every cost tied to generating a sale has been paid. It is not your Shopify dashboard revenue number, and it is not your bank deposit from Shopify Payments, both of which overstate the health of the business.
A good Shopify spreadsheet separates profit into tiers instead of jumping straight from sales to net profit. This matters because each tier tells you a different story about the business.
Profit tier | Formula | What it tells you |
Product Gross profit | Net sales − COGS | Are my products priced above their landed cost? |
Gross Profit | Product Gross Profit − fulfillment and payment fees | Does each order actually contribute cash? |
Contribution profit | Gross Profit − ad spend | Is marketing paying for itself? |
Net profit | Contribution Profit − operating expenses | Am I running a profitable business? |
Building your Shopify profit spreadsheet with these four tiers is the biggest single upgrade you can make to the standard template. Most Shopify spreadsheet templates stop at gross profit, which is why they flatter the numbers.
Why use a spreadsheet to track Shopify profit?
A Shopify spreadsheet centralizes the inputs Shopify reports in a dozen different places (payouts, orders, discounts, refunds, apps) and turns them into one answer. There are three practical reasons every Shopify store owner should maintain one, even a minimal one.
Shopify’s native reports do not calculate true Shopify profit. They show gross sales and Shopify-collected fees, but they do not know your COGS, your ad spend outside Shopify, or your fulfillment costs.
A Shopify spreadsheet makes trends visible. Month-over-month profit, margin decay on a hero SKU, or ad spend outpacing contribution margin all show up in a Shopify spreadsheet before they show up in your bank account.
A Shopify spreadsheet is auditable. Every number has a cell, every cell has a formula, and you can trace a surprising Shopify profit figure back to its input.
The cost of not maintaining a Shopify spreadsheet is making pricing, discount, and ad budget decisions from a revenue number that has almost nothing to do with profit.
Core components of Shopify profit
Before touching the Shopify spreadsheet, you need a clear list of everything that moves Shopify profit up or down. Missing any one of these is the most common reason spreadsheet-based Shopify profit tracking produces wrong answers.
Net sales (not gross sales)
Net sales is your starting line in a Shopify profit spreadsheet. It adjusts gross sales for the money that never actually belonged to the business.
Net Sales = Gross Sales − Discounts − Refunds − Returns
Record taxes collected on behalf of tax authorities separately. Treating sales tax as revenue inflates Shopify profit on paper and creates a liability later.
Cost of Goods Sold (COGS)
COGS captures the direct cost of putting a product in a customer’s hand: manufacturing or wholesale cost, raw materials, inbound freight, and product packaging that ships with the unit.
COGS = Units Sold × Landed Cost Per Unit
Use landed cost, not invoice cost. If a $10 product carries $2 of inbound freight and import duty, its COGS in your Shopify spreadsheet is $12. Treating freight as a separate line item once a quarter is a common way Shopify profit gets overstated.
Shopify fees and payment processing
Your Shopify spreadsheet should break platform fees into three rows because they move independently:
Monthly Shopify subscription (fixed).
Payment processing fees via Shopify Payments or a third-party gateway (variable, percent of sales).
Additional Shopify transaction fees if you use an external gateway (variable).
Paid Shopify apps also belong here. A $29/month app is $348 of annual Shopify profit disappearing silently if it is not tracked.
Marketing and ad spend
Marketing is usually the largest variable cost in a Shopify profit spreadsheet and the one most often underreported. Include:
Meta Ads (Facebook, Instagram).
Google Ads.
TikTok Ads.
Influencer and affiliate payouts.
Email and SMS tool subscriptions.
Creative production costs.
A Shopify spreadsheet that only tracks “Facebook ads” and ignores affiliate commissions will overstate contribution profit every month.
Fulfillment: shipping, packaging, 3PL
Fulfillment combines carrier costs, outer packaging, pick-and-pack fees, 3PL storage, and returns processing. If customers pay shipping at checkout, record that as a separate revenue line, not as a reduction to fulfillment cost, or your Shopify spreadsheet will distort both numbers.
Operating expenses
Operating expenses are the fixed cost of being in business: software subscriptions, salaries, contractor fees, bookkeeping, office costs, and professional services. These rarely move month to month, but they are what separate contribution profit (CM3) from true Shopify profit.
How to set up your Shopify profit spreadsheet
The structure of your Shopify spreadsheet decides whether it stays useful after month three. A single-tab Shopify profit spreadsheet gets messy fast. Split it into dedicated tabs so each category has one home.
Excel or Google Sheets?
Both work for a Shopify profit spreadsheet. The decision is operational, not mathematical.
Google Sheets: best if more than one person touches the Shopify spreadsheet, or you want it accessible from any device. Native version history is useful when a number changes and you need to know why.
Microsoft Excel: better if you want heavier analysis (Power Query to pull Shopify CSVs, pivot tables, PowerPivot models). More horsepower, less collaboration.
For the vast majority of Shopify stores, a Google Sheets Shopify profit spreadsheet is the right default.
The seven-tab Shopify spreadsheet structure
Build your Shopify spreadsheet with these tabs in this order:
Summary: the Shopify profit dashboard with gross profit, product gross profit, contribution profit, net profit.
Sales: gross sales, discounts, refunds, shipping income, net sales.
COGS; SKU-level unit cost and quantity sold.
Shopify fees: subscription, payment processing, app costs.
Ads: one row per channel.
Fulfillment: shipping, packaging, 3PL, returns.
Operating expenses: payroll, software, bookkeeping, etc.
The Summary tab pulls from every other tab using SUM and cell references. You never type a number into Summary; it is calculated.
Essential columns per tab
Every transactional tab in the Shopify spreadsheet needs at least four columns: Date, Category, Description, Amount. Add a Channel column if you sell across Shopify, TikTok Shop, Amazon, and wholesale, so you can filter Shopify profit by channel later using SUMIF.
Step-by-step: Calculating Shopify profit in a spreadsheet
The worked example below runs one month through the Shopify profit spreadsheet. The numbers are illustrative; the structure is what to copy.
Step 1: Enter sales revenue and calculate net sales
Enter gross sales, discounts, and refunds in the Sales tab.
Line item | Cell | Amount |
Gross sales | B2 | $10,000 |
Discounts | B3 | $500 |
Refunds | B4 | $300 |
Net sales | B5 | $9,200 |
Formula in B5:
=B2-B3-B4
Net sales is the number every Shopify profit formula below runs against. Gross sales is not.
Step 2: Enter COGS and calculate gross profit
In the COGS tab, calculate COGS at the SKU level and sum it:
SKU | Units | Unit cost | COGS |
A | 200 | $8 | $1,600 |
B | 100 | $14 | $1,400 |
Total COGS | $3,000 |
Pull total COGS into the Summary tab and calculate gross profit:
Gross Profit = Net Sales − COGS
=9200-3000 = $6,200
Gross margin:
=6200/9200 = 67.4%
Step 3: Deduct Shopify fees, fulfillment, and payment processing to get product gross profit
Pull in platform and variable per-order costs:
Cost | Amount |
Shopify subscription | $39 |
Payment processing (2.9% + 30¢) | $280 |
Shipping and packaging | $700 |
Total order-level costs | $1,019 |
Product Gross Profit = Gross Profit − Order-level costs
=6200-1019 = $5,181
Product gross profit is the first Shopify profit tier that tells you if each order is pulling its weight.
Step 4: Deduct ad spend to get contribution profit
Contribution Profit = Product Gross Profit − Ad Spend
=5181-1500 = $3,681
If contribution profit goes negative, you are buying growth with cash you do not have. A Shopify spreadsheet that calculates contribution profit monthly catches this one month before the bank balance does.
Step 5: Deduct operating expenses to get net Shopify profit
Net Shopify Profit = Contribution Profit − Operating Expenses
=3681-400 = $3,281
Step 6: Calculate net profit margin
Net Profit Margin = (Net Profit ÷ Net Sales) × 100
=(3281/9200)*100 = 35.66%
A 35% net Shopify profit margin is strong. Most Shopify stores run between 5% and 20% once every cost is included honestly.
Essential formulas for your Shopify profit spreadsheet
These are the formulas every Shopify spreadsheet should contain. Paste them into the Summary tab of your Shopify profit spreadsheet and change the cell references to match your layout.
Core Shopify profit formulas
Metric | Spreadsheet formula |
Net sales |
|
Gross profit |
|
Product Gross Profit |
|
Contribution profit |
|
Net profit |
|
Net profit margin |
|
Useful operational formulas
Metric | Spreadsheet formula |
Average order value (AOV) |
|
Cost per acquisition (CPA) |
|
Return on ad spend (ROAS) |
|
Marketing efficiency ratio (MER) |
|
Category-level total |
|
Channel-level Shopify profit |
|
The SUMIF and SUMIFS combination is what turns a static Shopify spreadsheet into a Shopify profit dashboard you can slice by channel, SKU, or month.
Common misses when calculating Shopify profit in a spreadsheet
Even a well-built Shopify profit spreadsheet produces wrong numbers if the inputs are off. These are the five mistakes that show up most often.
Forgetting payment processing fees
Confusing gross sales with net sales
Missing recurring app and software costs
Tracking ad spend from only one platform
Updating the Shopify spreadsheet quarterly instead of monthly
How to keep your Shopify profit spreadsheet accurate
Building the Shopify spreadsheet is the easy part. Keeping it accurate for twelve months is where most store owners fail. Four habits make the difference.
Reconcile against Shopify payouts. The deposits Shopify sends to your bank are the ground truth. If the Shopify profit spreadsheet shows $12,000 of net sales and payouts total $11,400, the gap is either unrecorded refunds or fees you missed.
Separate fixed from variable costs. Fixed costs (subscription, payroll, rent) belong in operating expenses. Variable costs (COGS, fulfillment, processing, ads) belong above CM3. Mixing the two makes it impossible to model what happens when sales double.
Keep a change log. A simple “Notes” tab in the Shopify spreadsheet, dated by month, explains why a number jumped. Future-you will not remember that COGS went up because of a tariff change.
Review Shopify profit trends, not single months. A three-month rolling average of net profit margin tells you more about the business than any single month of the Shopify spreadsheet.
Conclusion
A Shopify spreadsheet is the right tool somewhere between $0 and a few hundred orders per month. Past that, three things break.
SKU-level COGS becomes manual pain.
Multi-channel attribution gets fuzzy.
Ad platforms report on their own schedule.
At that point, a profit analytics tool that connects directly to Shopify, your ad platforms, and your other sales channels starts to pay for itself. Bloom, for example, calculates gross profit, Contribution profit and net profit automatically across Shopify and other channels like TikTok Shop, so the profit tiers in this guide update without anyone touching a spreadsheet. The Shopify spreadsheet still has its place as a sanity check, but it stops being the system of record.

Frequently asked questions
What is a good Shopify profit margin?
Most healthy Shopify stores run a net Shopify profit margin between 10% and 20% once COGS, fees, ads, fulfillment, and operating expenses are included. Anything above 20% is strong; anything below 5% means the next ad spend increase or COGS shock will likely tip the store into losses.
What is the best free Shopify profit spreadsheet template?
The best Shopify spreadsheet is the one you build yourself with the seven-tab structure above (Summary, Sales, COGS, Shopify Fees, Ads, Fulfillment, Operating Expenses). Free templates from the web usually collapse everything into one tab and stop at gross profit, which hides contribution margin and net profit entirely.
How is Shopify profit different from Shopify revenue?
Shopify revenue is the total money customers paid your store. Shopify profit is what remains after COGS, Shopify fees, payment processing, ads, fulfillment, and operating expenses are deducted. A store doing $100,000 in monthly revenue can easily end the month with $5,000 to $15,000 in net Shopify profit, depending on margin structure.
How often should I update my Shopify profit spreadsheet?
Weekly if you spend on ads daily, monthly at the absolute minimum. A quarterly cadence means pricing, promo, and ad budget decisions are being made from stale data, which is where most Shopify spreadsheet systems silently go wrong.
Does Shopify calculate net profit automatically?
No. Shopify reports gross sales, discounts, refunds, and Shopify-collected fees, but it does not know your COGS, your ad spend outside of Shopify, or your fulfillment costs. Calculating true Shopify profit requires either a Shopify spreadsheet or a dedicated profit analytics tool connected to all your cost sources.
What formulas do I need for a Shopify profit spreadsheet?
At minimum: net sales (=GrossSales-Discounts-Refunds), gross profit (=NetSales-COGS), contribution margin (=CM1-Fees-Fulfillment), contribution profit (=CM2-AdSpend), net profit (=CM3-OpEx), and net profit margin (=(NetProfit/NetSales)*100). Add SUMIF to roll up expense categories automatically.
Can I calculate Shopify profit by sales channel in a spreadsheet?
Yes. Add a Channel column to every tab of your Shopify spreadsheet and use SUMIFS to filter net profit by channel (Shopify, TikTok Shop, Amazon, wholesale). This is the single most useful upgrade for stores selling on more than one platform.
Discover More