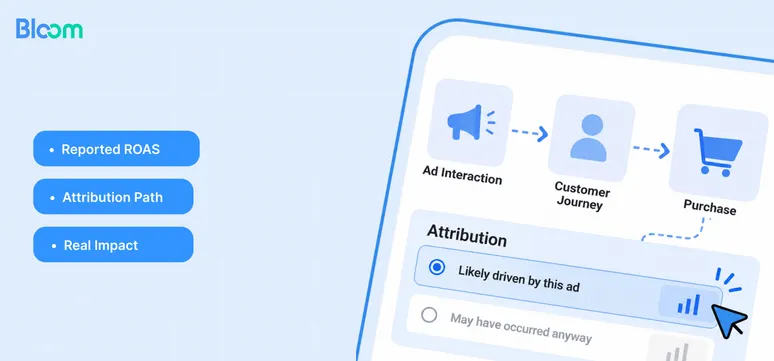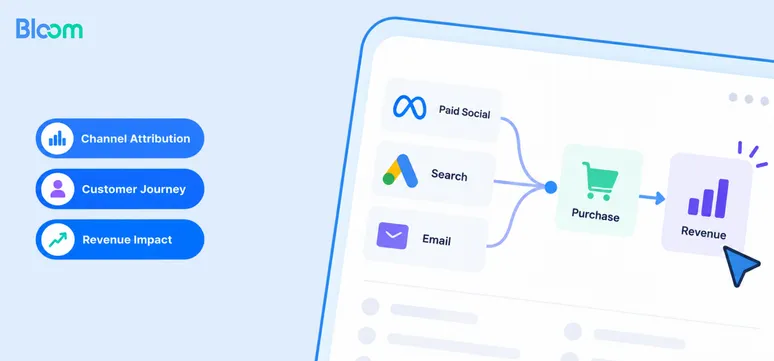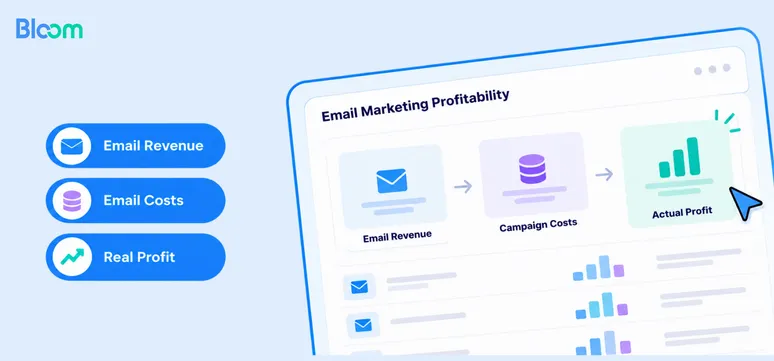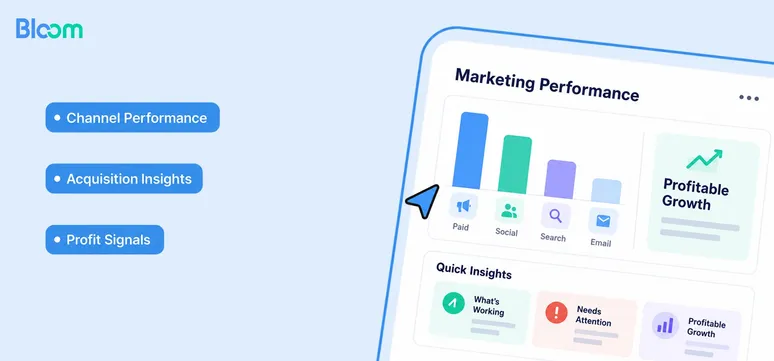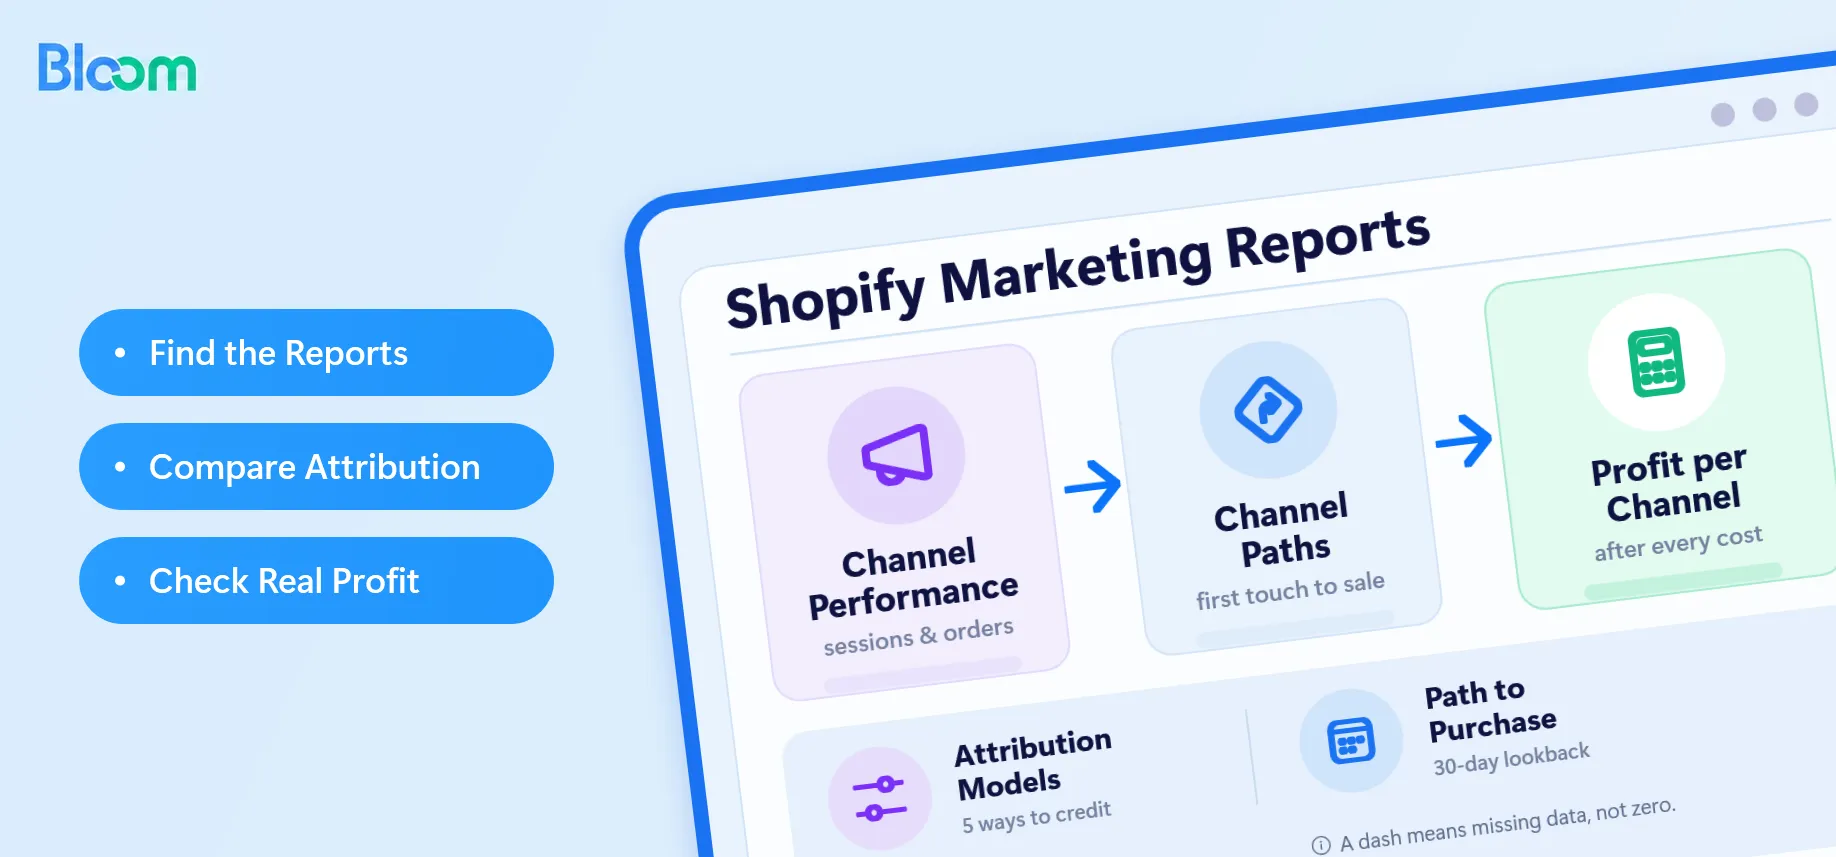



Shopify Marketing Reports show how your marketing is working. They tell you which channels brought visitors, which campaigns turned into orders, and how customers moved through your funnel before they bought. They cover five attribution models, path-to-purchase journeys, and some cost data from the channels that share spend back with Shopify.
They are a strong source for what happened in your marketing. They are a weak source for what it cost, what it earned you in profit, and what you should change next, which is where most budget decisions start to wobble.
This guide walks through how to find the Shopify Marketing Reports, what each one does, how to read them together, and how to turn what they show into budget calls you can actually defend.
Key Takeaways
- Shopify Marketing Reports live under Analytics → Reports, filtered by the Marketing category.
- You get eight core views: channel performance, campaign performance, channel paths, Autopilot results, Shop impressions, and three path-to-purchase medians.
- Five attribution models are available: Last non-direct click, Last click, First click, Any click, and Linear.
- Ad spend, ROAS, CPA, and CAC only show up for channels that sync cost back to Shopify. A dash means missing data, not zero.
- Ad spend never reaches Shopify's Finance or Profit reports, so contribution margin and net profit cannot be read from these reports alone.
How to Find Shopify Marketing Reports
From your Shopify admin:
- Go to Analytics → Reports.
- Click the Category filter.
- Pick Marketing to narrow the list.
Each report opens on the last 30 days and compares it with the period before. You can change the dates, how the data is grouped, and the comparison from the controls at the top. On the channel and campaign reports, you can switch attribution models or view a few side by side.
The Marketing Reports, One by One
Performance by Marketing Channel
What it has. Every marketing channel on your store side by side, split into paid, organic, direct, unattributed, and unknown traffic. You get sessions, orders, conversion rate, total sales, AOV, first-time and returning customers, plus ad spend, ROAS, CPA, CAC, impressions, clicks, and CTR where cost data is available. You can compare all five attribution models and break a channel down further, so a Meta Ads row can split into Facebook and Instagram.
How it helps. Pair sessions with conversion rate to spot channels bringing traffic that is not turning into sales. Use AOV and the new-versus-returning split to judge customer quality. Where cost data is there, ROAS, CPA, and CAC show spending efficiency. Looking at First click next to Last non-direct click separates channels that introduce shoppers from the ones that close the sale.
Note: Any-click can double-count credit, and Referring channel does not combine with cost or engagement metrics.
Performance by Marketing Campaign
What it has. The same metrics as the channel report, grouped by campaign. A campaign running across several channels shows on one row with its combined performance. You can view it campaign-first or channel-first.
How it helps. Start with sessions, orders, conversion rate, total sales, AOV, and first-time customers to find the campaigns pulling real weight, then check the channel breakdown and any cost data before scaling. Compare two attribution models first, because a campaign that looks weak on last-click may be doing discovery work First click or Linear credits more fairly.
Note: Traffic not tied to a campaign is excluded, and attributed sales do not prove those sales would not have happened otherwise.
Total Sales by Marketing Channel Path
What it has. The sequence of channels a customer touched before buying, for example Instagram, then Google Search, then Email. Each path shows total sales, orders, and AOV, ranked by sales, and looks back up to 30 days before each order.
How it helps. This is where you see channels working together rather than one closing the sale alone. A path like social, search, then email tells you social introduced the customer and email brought them back. Compare sales and orders against AOV so you do not favour a path that only looks strong because of a few large orders.
Note: Orders without a marketing channel path are excluded, so this is not a complete sales view.
Performance by Autopilot
What it has. Results for the individual tactics Autopilot runs, such as email automations and ad campaigns. You get reach, sessions, orders, sales, and a timeline of what Autopilot did and when.
How it helps. Compare tactics with similar goals over similar time windows. Use sessions to judge traffic-driving tactics, then orders and sales to see whether that traffic bought. Reach on its own is not a result. For detailed ad metrics, open the ad platform.
Note: Early results while a platform is still learning can look off and should not drive quick cuts.
Shop Channel Product Impressions
What it has. A count of how often your products were viewed on the Shop channel, by time or by product.
How it helps. The time view shows whether your Shop visibility is rising or dropping. The product view shows which items are drawing attention. Treat it as a visibility signal, not a sales number, and remember it is a Shop channel metric, not a Shop Campaigns metric.
Note: Some Shop numbers are hidden when activity is low, and missing data is not the same as zero.
Path to Purchase Medians
Three related numbers describe the shape of your buying journeys, across orders with at least one marketing touchpoint.
Median time to purchase is the middle length of time between a customer's first recorded touchpoint and their purchase. Use it to plan follow-up messaging and judge whether journeys are getting shorter or longer. A shorter journey is only a win if buyer counts and order values hold up.
Median time between marketing touchpoints is the typical gap between back-to-back interactions in journeys that led to an order. Use it as an input to messaging cadence, not a prescribed schedule.
Median marketing touchpoints is the middle count of marketing interactions before an order, including repeats. A median of 3 does not mean customers used three different channels. Use it to see whether your typical journey is a single touch or several.
Note: All three cover buyers only and are not targets to raise or lower on their own.
How to Read the Reports Together
No single Shopify Marketing Report answers "is this working?" on its own.
Start with Performance by marketing channel. Last 30 complete days, compared with the period before. Review sessions, conversion rate, orders, total sales, AOV, and first-time customers, and add ad spend, ROAS, and CAC where they show up. Weak conversion is a reason to look at the audience, offer, or landing page, not to cut the channel. Strong sales alone are not a reason to raise budget until you have checked cost and margin.
Then open Performance by marketing campaign. Look inside each channel instead of treating it as one bucket. Campaigns inside a channel can behave very differently, and the average hides the winners and losers. Find the campaigns driving real orders at an acceptable cost and test shifting budget from weaker campaigns to those winners.
Use Total sales by marketing channel path to spot supporting channels. A path like social, then search, then email makes it clear email did not do all the work on its own. Use it to decide which channels deserve credit for discovery before you decide what to trim.
Check attribution before cutting anything. Compare Last non-direct click with First click or Linear. First click flags channels that introduce shoppers, Last non-direct click flags closers, and Linear spreads credit. Cutting a channel on one model alone is the quickest way to kill the top of your funnel.
Make one decision a week, then measure it. Keep the date range, attribution model, and filters consistent from one review to the next. Record what you changed and check whether conversion and acquisition costs improve, not just revenue.
Two quick reminders. A dash in a spend column means the number is missing, not that the traffic was free. And ROAS compares revenue against ad spend, not profit, so a 4x ROAS on an item with a 20% contribution margin is still losing money once fulfillment and operating costs land.
What You Actually Need to Make a Clear Budget Decision
Shopify Marketing Reports tell you which channels drove sessions and orders. A budget decision you can defend needs more than that.
Blended cost across every channel. Not just the channels Shopify can see, but every platform sending traffic, including Meta, Google, TikTok Shop, GMV Max, and affiliates. Partial cost data makes the visible channels look better than they are and quietly starves the ones Shopify cannot see.
Profit per channel, not just revenue. Revenue tells you which channels brought orders. Profit tells you which of those orders were worth winning. You need a breakdown that shows product gross profit after COGS, profit after fulfillment, contribution profit after ad spend, and net profit after operating costs, attached to each channel, campaign, and product.
A consolidated view across stores. If you run more than one storefront, split DTC and wholesale, or sell on marketplaces alongside Shopify, the numbers need to roll up before any decision is made. Budget calls inside one store view are how good channels get cut on bad data.
Reconciled numbers, not just visible ones. Privacy restrictions, ad blockers, and attribution differences all distort what reaches Shopify. The answer is not to pick one source and trust it blindly, but to merge Shopify data, platform data, and actual sales results into one reconciled view, so no channel is judged on its weakest signal.
Diagnosis, not just description. Shopify shows what happened. A budget call needs the next step: which campaigns to scale, which to cut, which products are quietly losing money on paid traffic, and which channels are doing more work than last-click credits them for.
Conclusion
Shopify Marketing Reports do the first half of the job well. They show which channels drove sessions, which campaigns pulled orders, and how customers moved through the funnel. What they do not show is cost across every channel, profit after that cost lands, a view that holds up across multiple storefronts, or a clear next step once the review is done.
Bloom is built for that second half. It installs on Shopify, pulls in the ad platforms and cost sources Shopify leaves on the table, and turns the result into one reconciled view with blended spend next to revenue, a full profit stack from gross profit to net profit per channel and campaign, and multiple stores rolled up on the same definitions.
Shopify tells you which channels drove orders. Bloom tells you which of them actually made money, which is where a defensible budget decision has to start.
See Which Marketing Channels Bring in Real Money
Frequently Asked Questions
Why Is Ad Spend Missing On Some Of My Channels?
A dash means the channel does not sync cost back to Shopify, or the cost data has not landed yet (it can lag up to 24 hours). It does not mean the traffic was free. Pull cost from the ad platform itself and reconcile.
Does Shopify Calculate Profit From Its Marketing Reports?
No. Ad spend in Marketing does not flow into Finance or Profit reports. To get contribution margin or net profit you need COGS, fulfilment fees, blended ad spend, and operating costs in one place.
Why Don't Shopify's ROAS Numbers Match Meta Or Google?
Different attribution rules, lookback windows, and data access. The platforms almost never match to the dollar. Use both and resolve the gap against actual order and refund data.
Are Cancelled Or Unpaid Orders Included?
Yes. Marketing reports include cancelled, pending, and unpaid orders, and exclude test and deleted orders. They are not a view of cash received.
How Recent Is The Data?
Marketing data can take up to 24 hours to update, and app-reported cost data can lag further.
Do Shopify Marketing Reports Work For Multi-Store Or Omnichannel Setups?
Not natively. Reports are bound to one store view. Regional storefronts, DTC and B2B/wholesale sites, and marketplace channels have to be rolled up outside Shopify.