Get a clear answer to your pressing questions:
Data‑Led Decisions on
Where to Invest or Pull Back
Seamless Integration for
Better Insights
Connect your ad, shipping, and expense platforms. Bloom unifies every data source to steer your Shopify brand toward higher profitability.
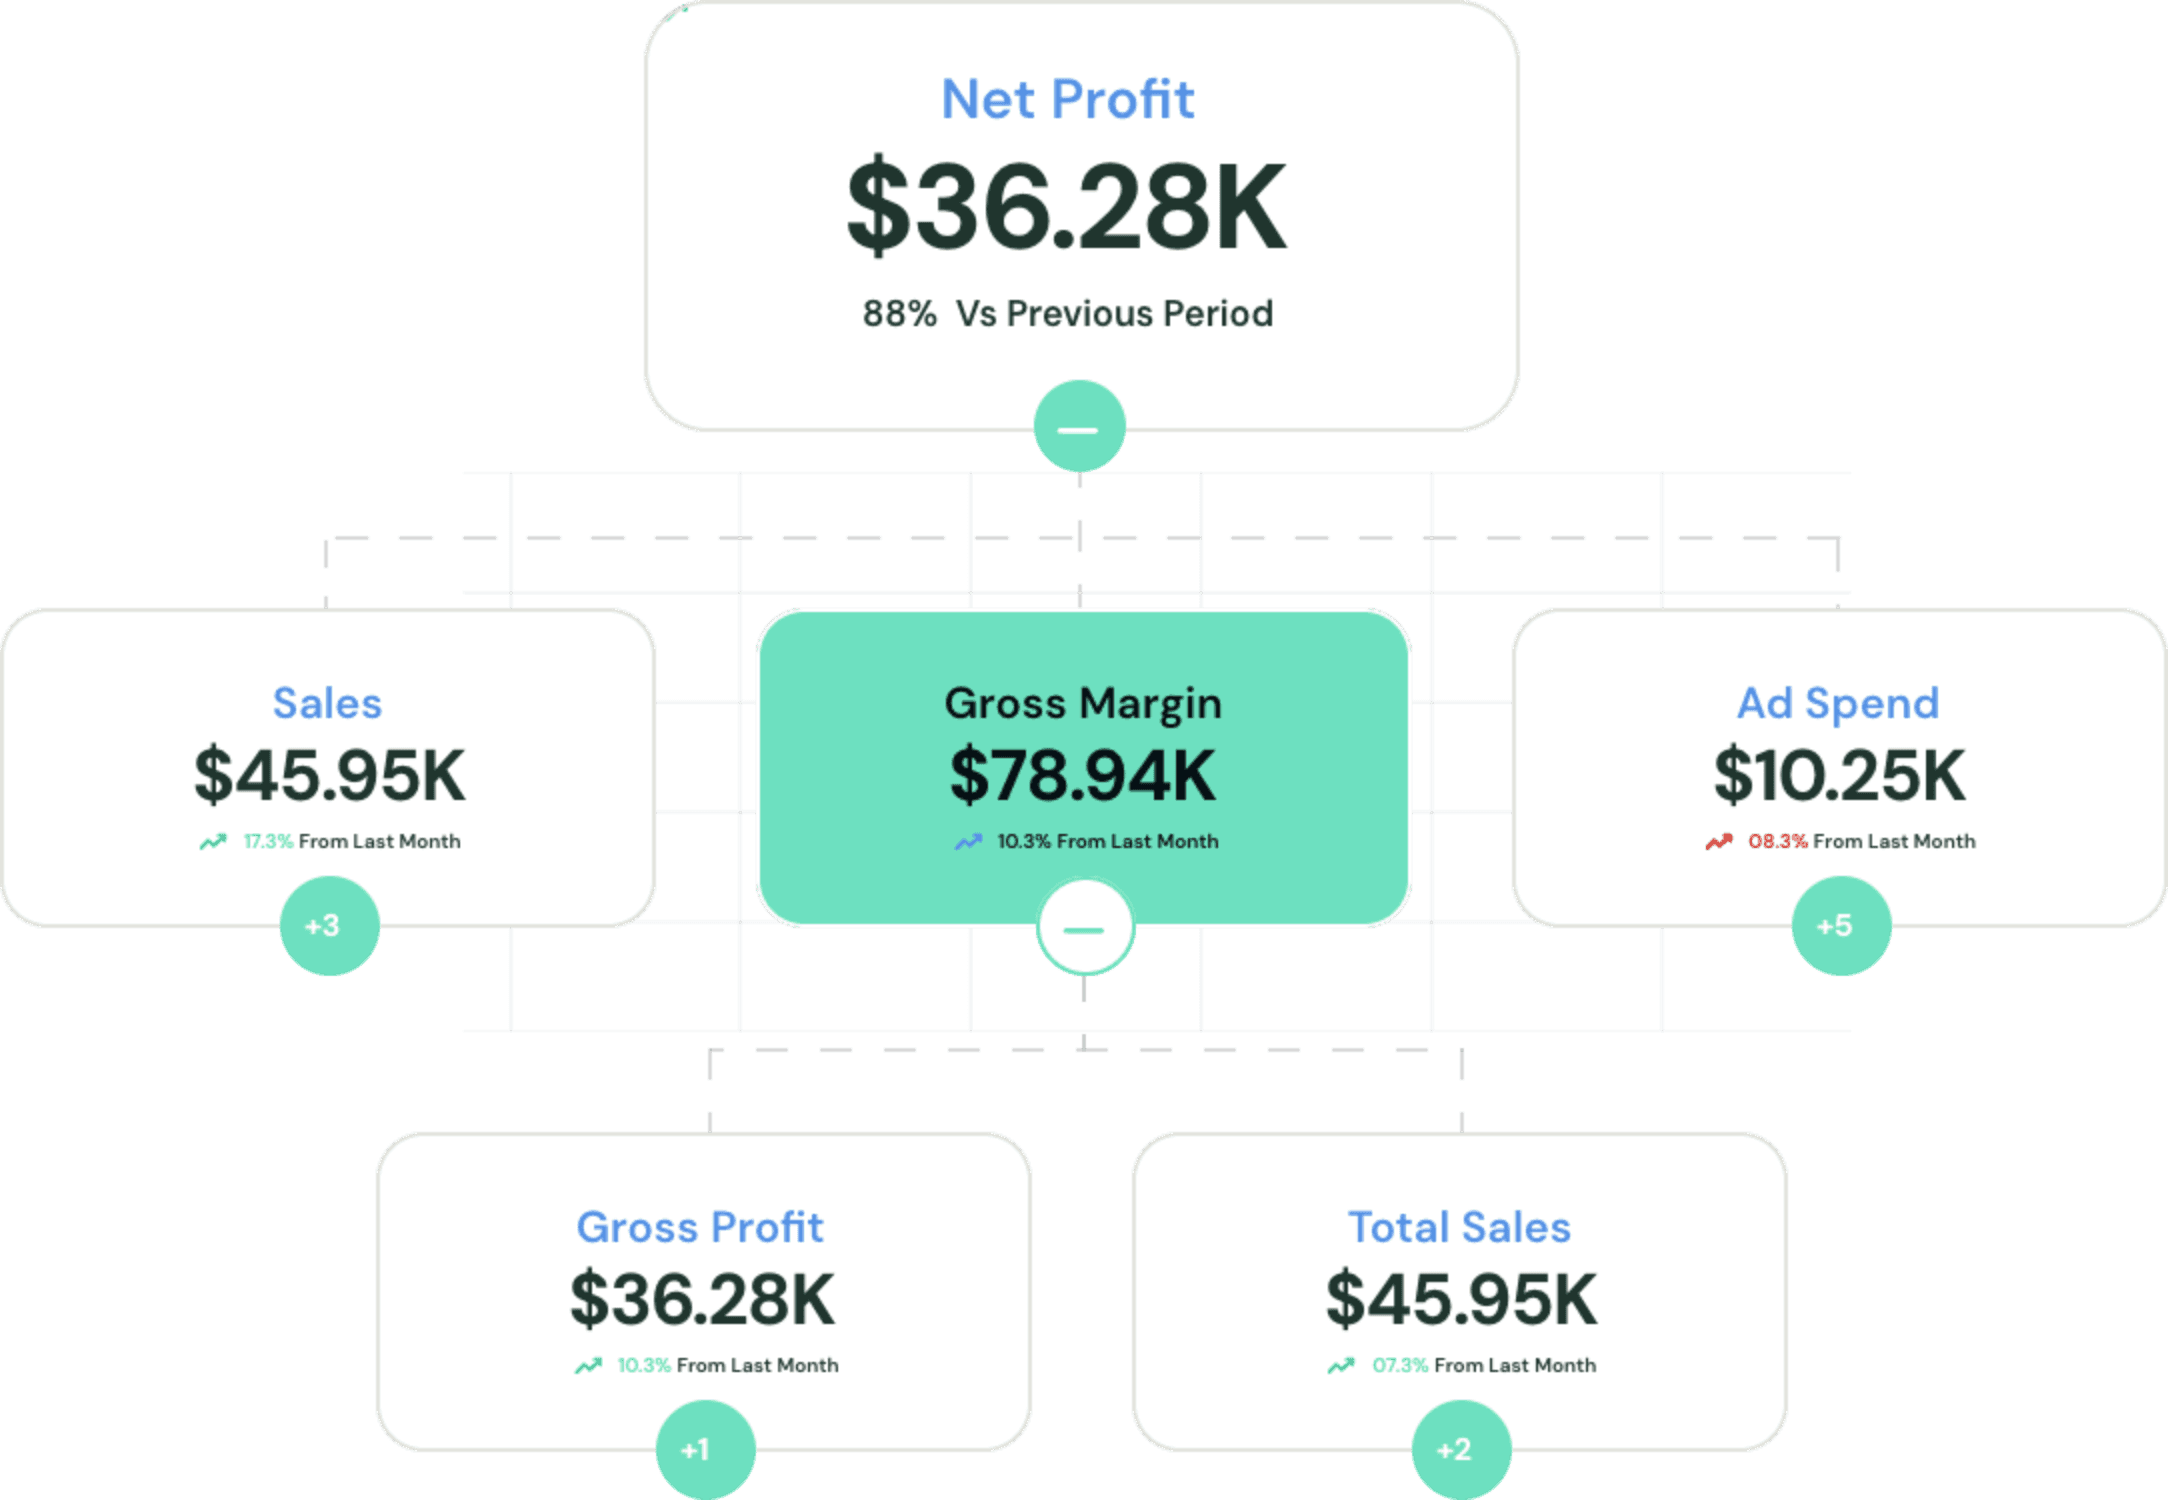
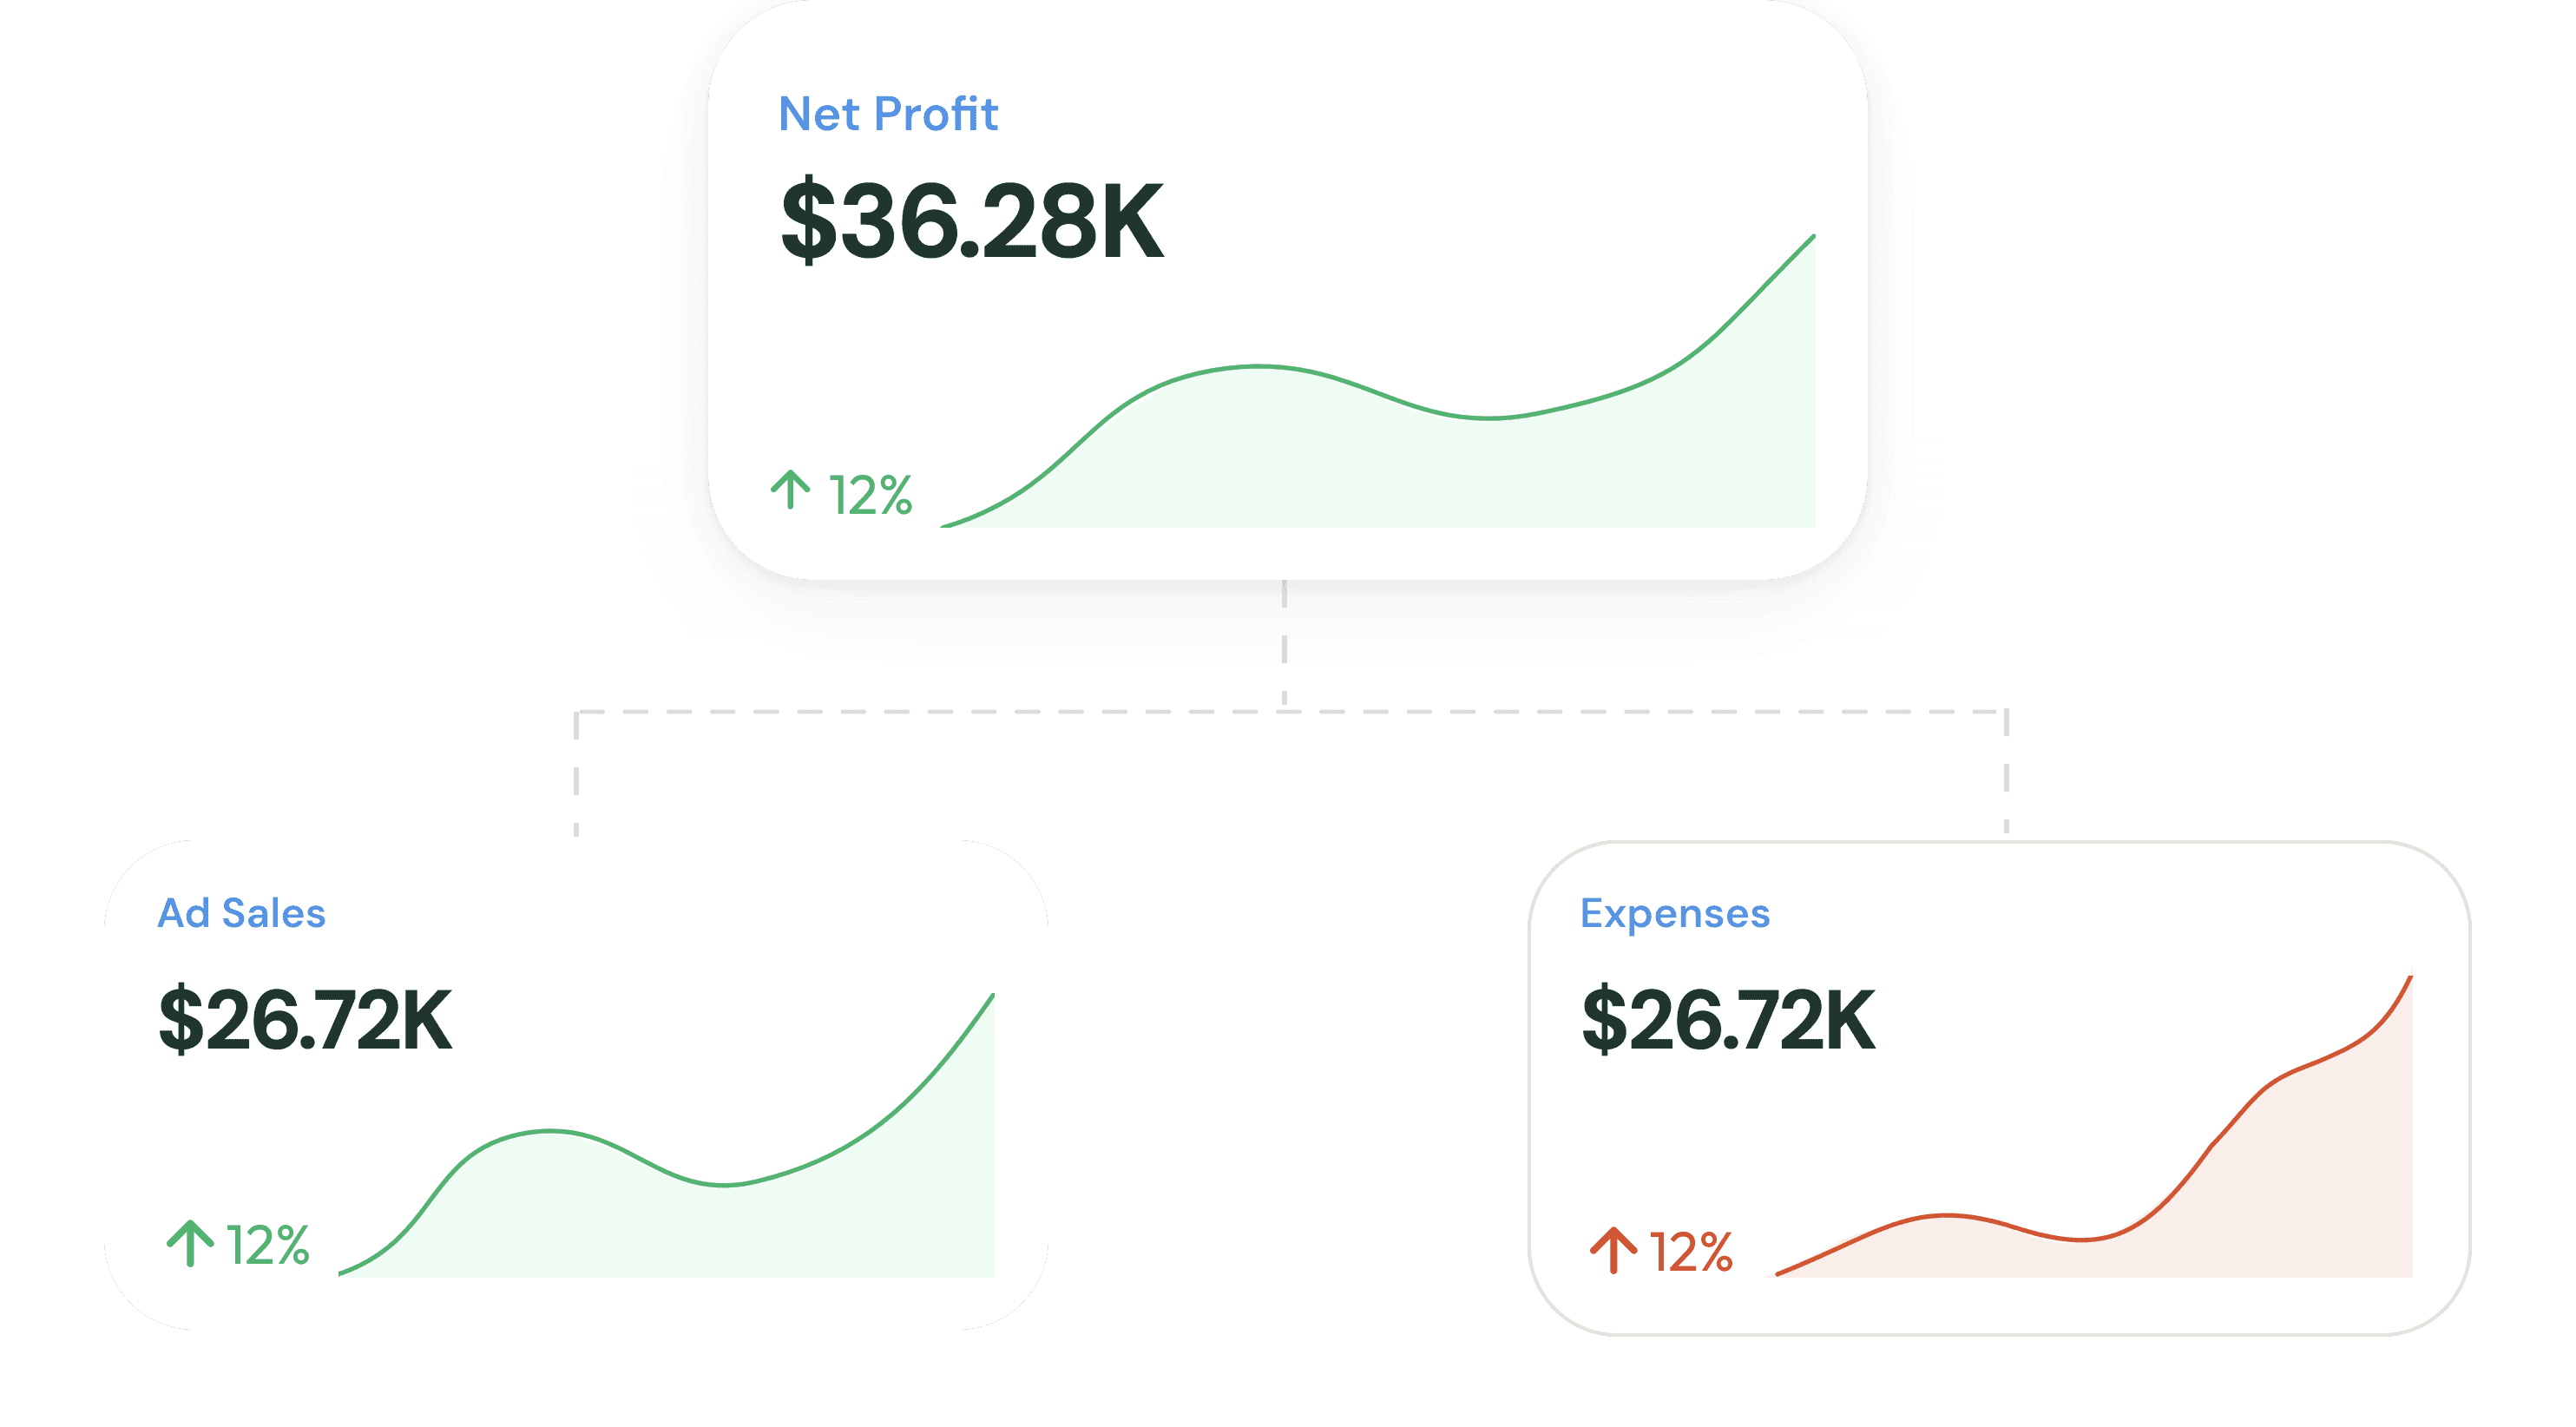
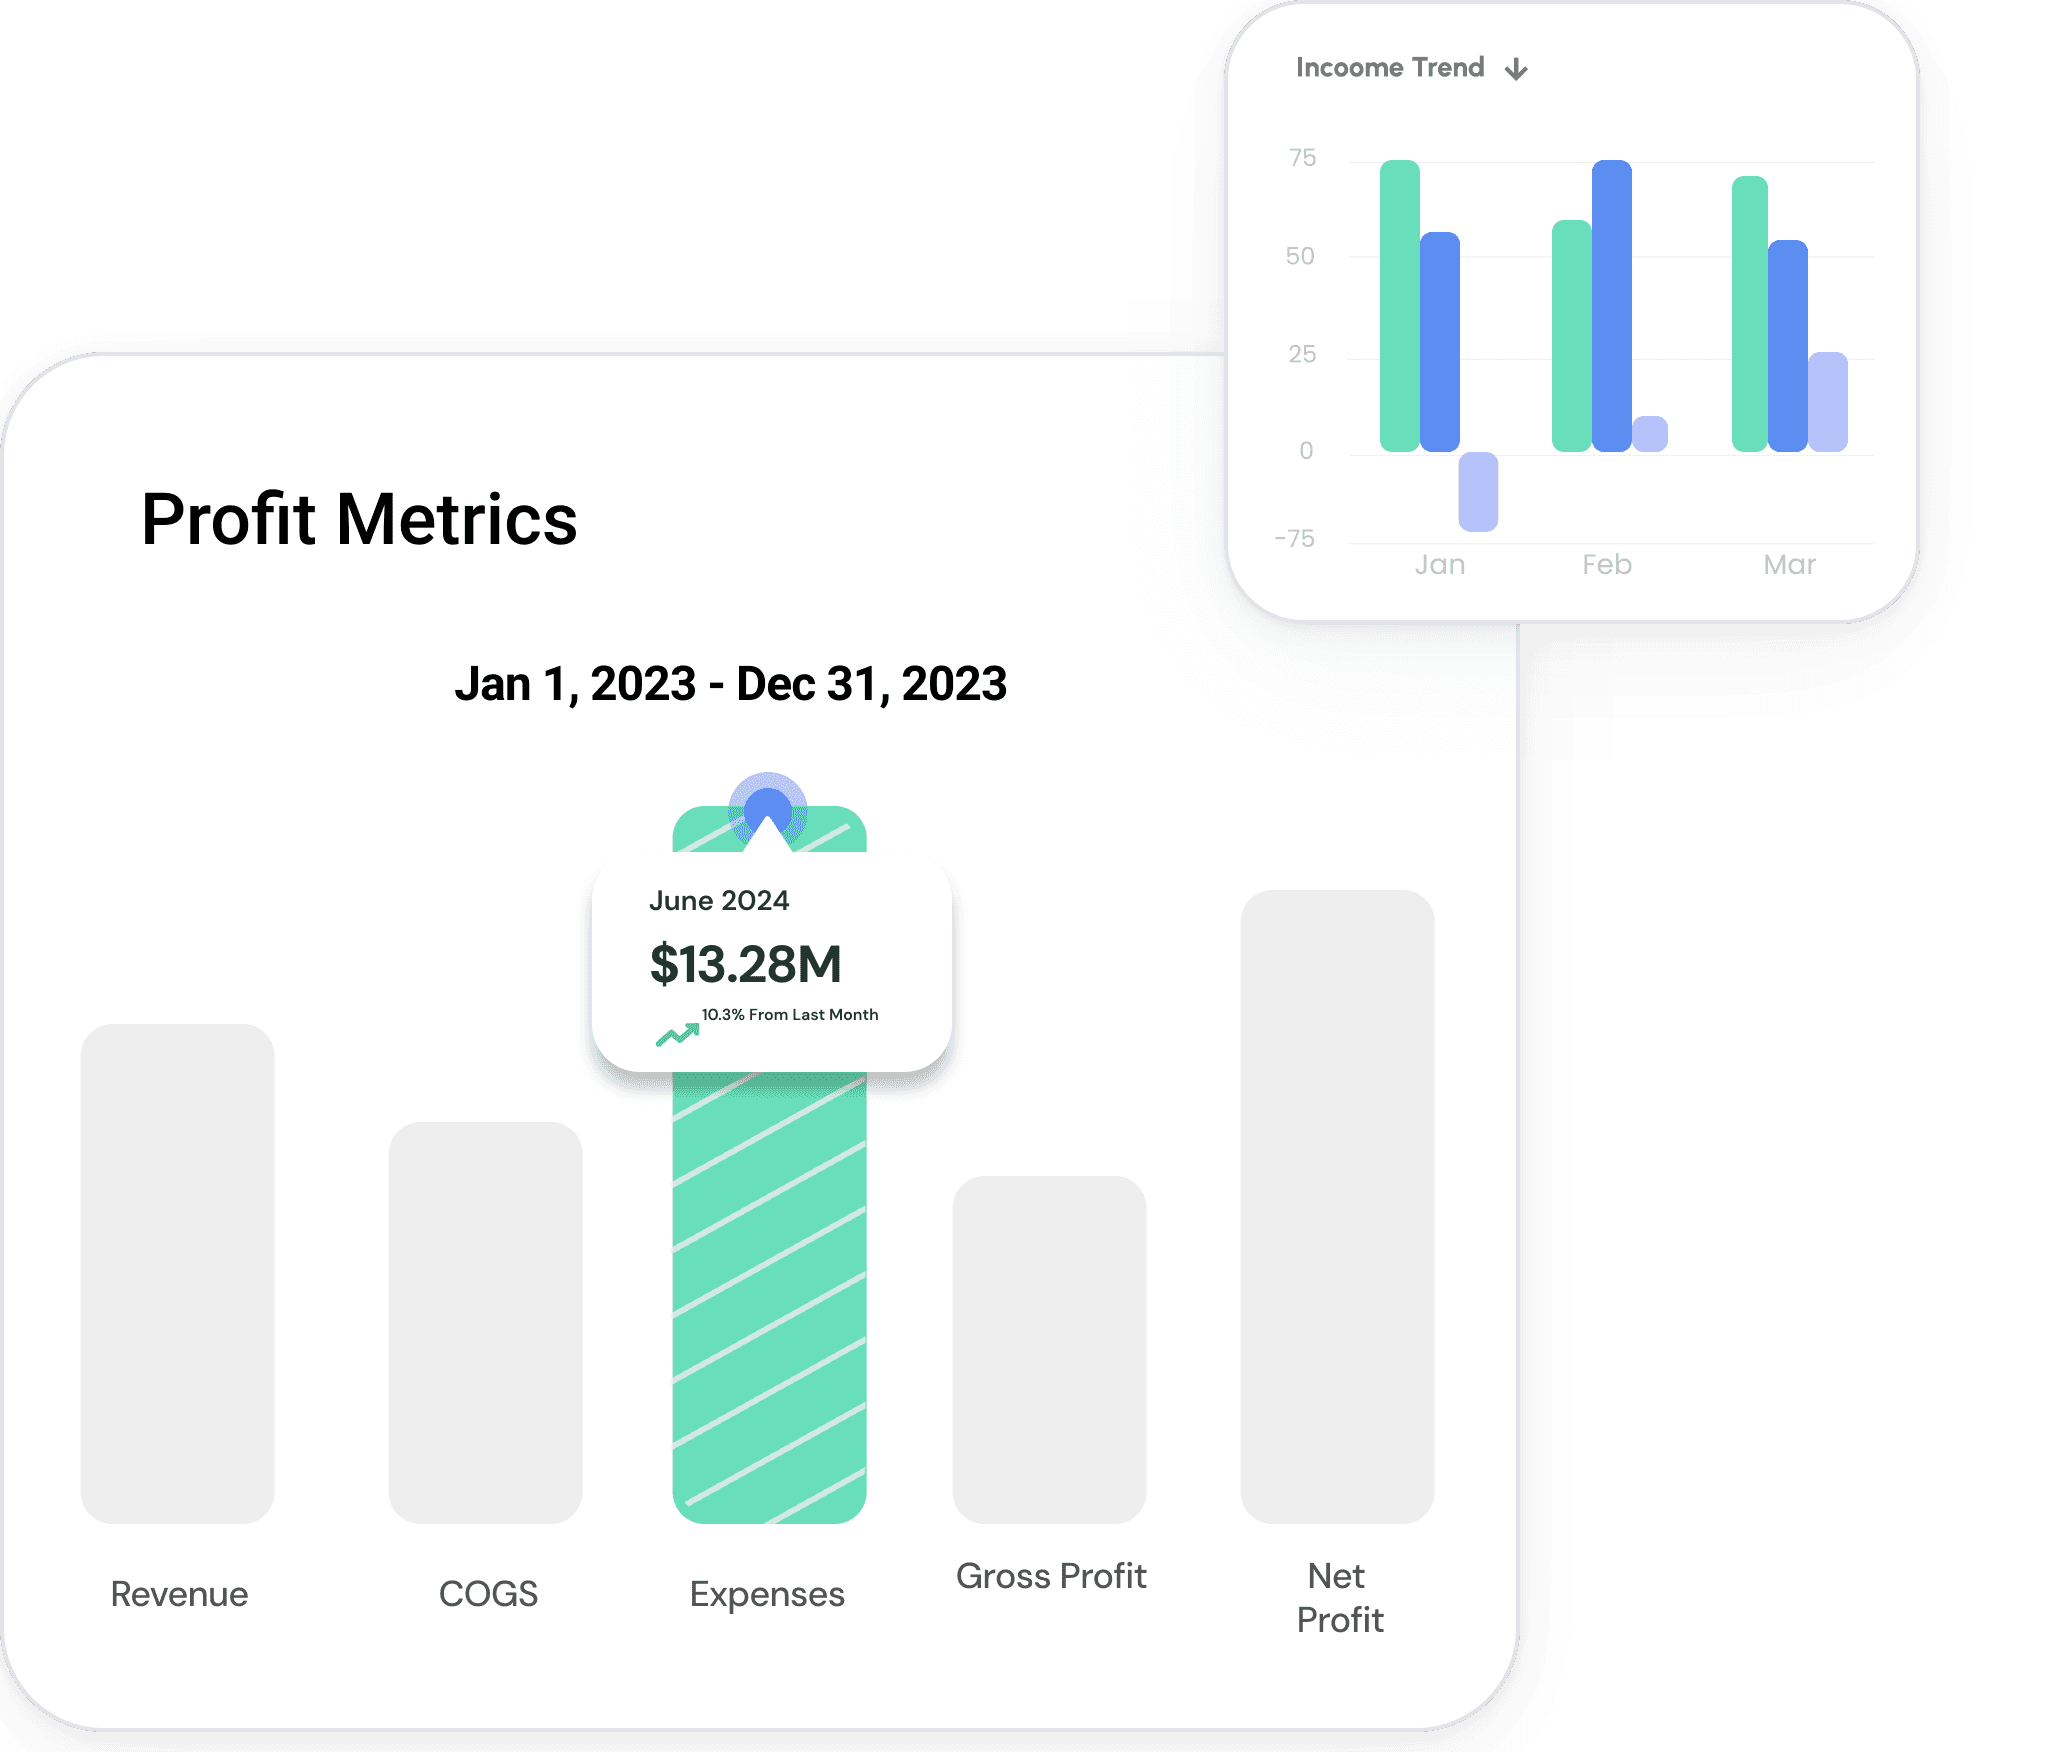
Profit Map and Profit Report take the complexity out of understanding profitability, giving you the insights you need to make confident business decisions.
Revenue Breakdown
Instantly see how much revenue your Shopify store is generating.

Expense Allocation
Easily track where every dollar is going.

Historical Comparisons
Compare profit drivers across any time period.

Interactive Interface
Entrepreneur‑friendly visuals - no data science degree required.

Table Format Option
Prefer spreadsheets? View the same data in table layout.

Custom Integrations
Plug in all cost sources - ads, shipping, operating expenses & more.


