Know every decision and every motivation of your customers
Optimize
the Buyer Journey of Your Products
Know every decision and every motivation of your customers
Know every decision and every motivation of your customers
Turn insights into actions that delight
Turn insights into actions that delight
Turn insights into actions that delight
Customer Metrics and Retention Cohorts give you the tools to analyze customer behavior and boost retention with data-driven strategies.
Customer Metrics and Retention Cohorts give you the tools to analyze customer behavior and boost retention with data-driven strategies.
Customer Metrics and Retention Cohorts give you the tools to analyze customer behavior and boost retention with data-driven strategies.


Engage Better with Your Most Profitable Customers
Engage Better with Your Most Profitable Customers
Engage Better with Your Most Profitable Customers
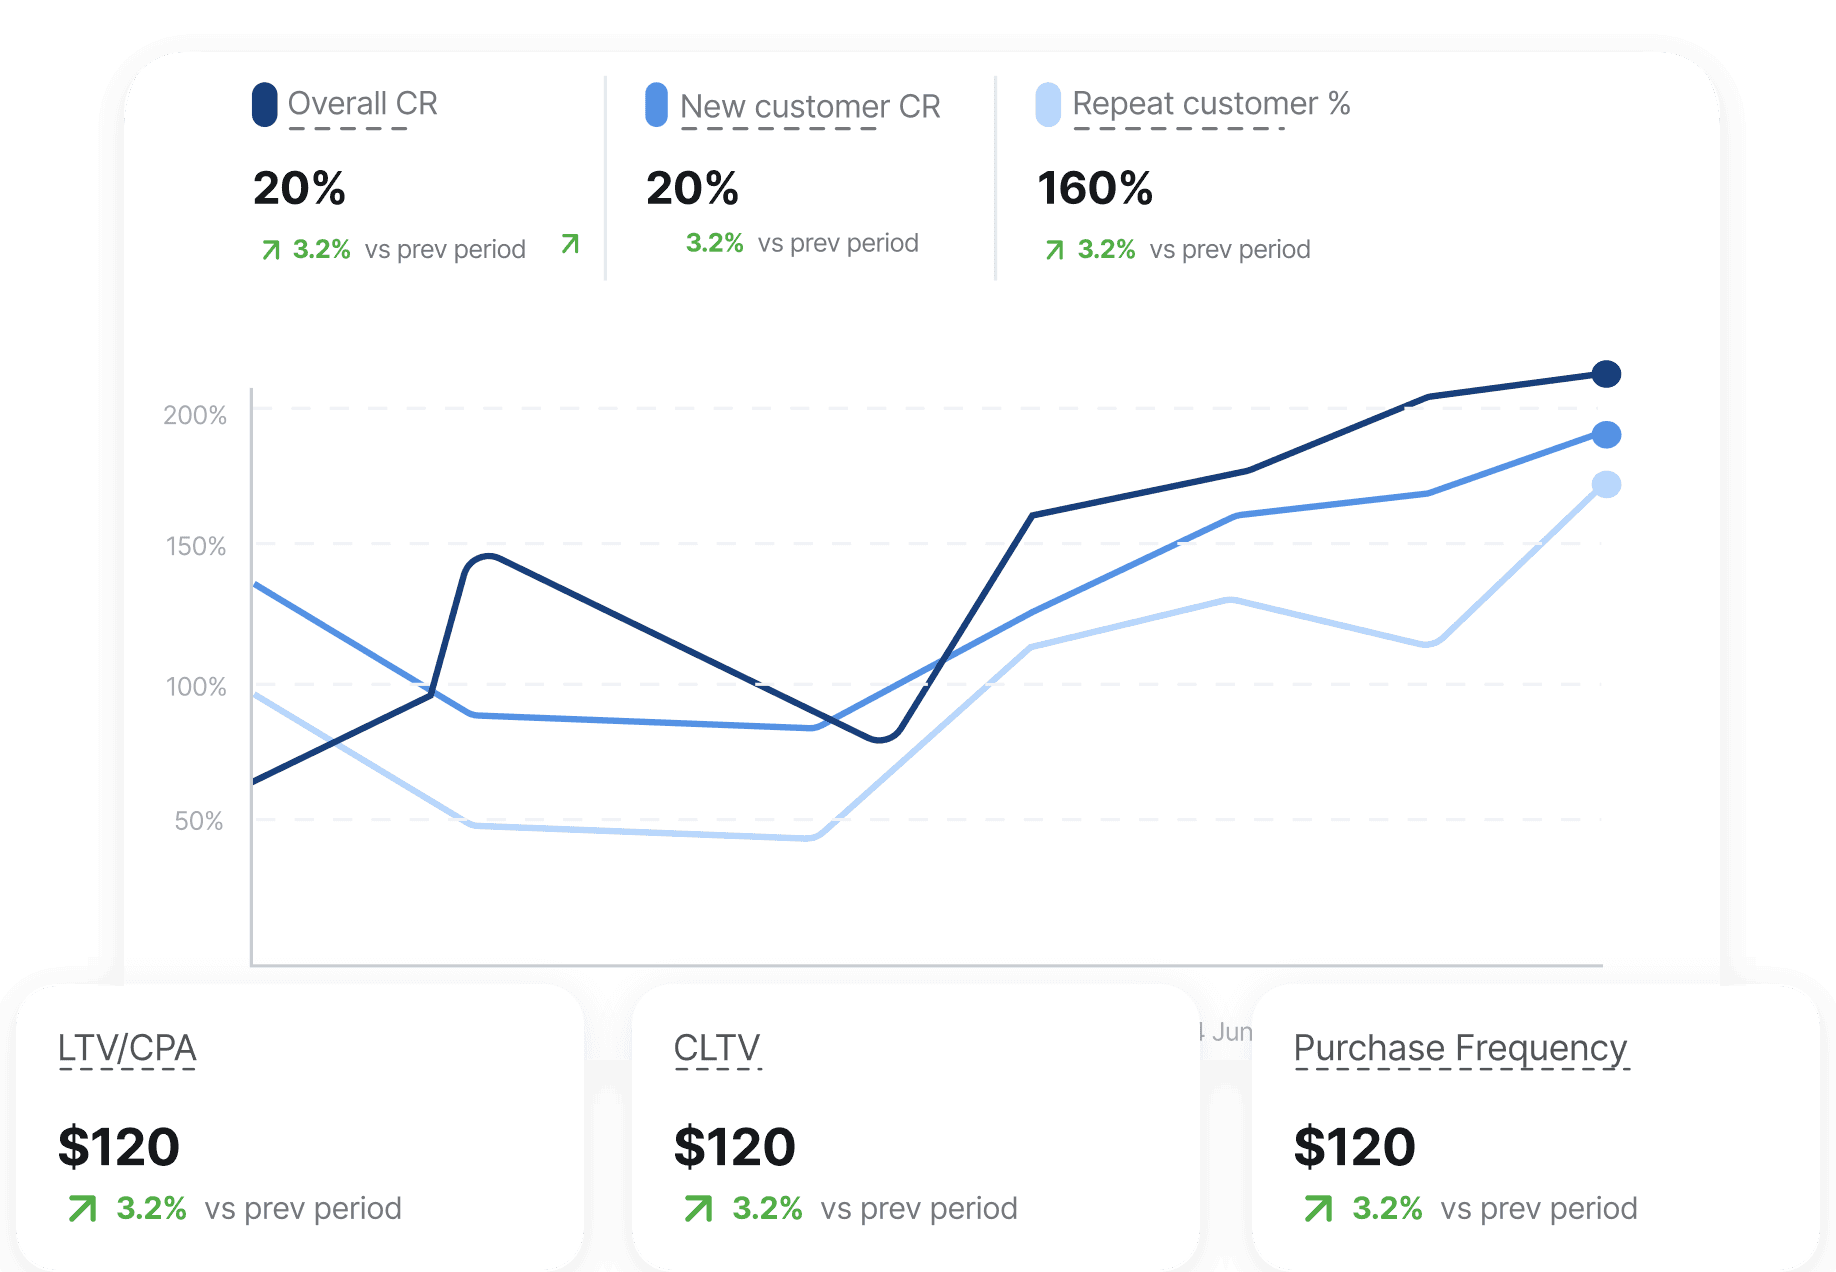
Identify, segment and categorize your customer base to engage with them uniquely:
See how many of your customers are repeat buyers vs. new customers.
Track customer behavior based on purchase frequency, spending amount, and recency of purchase.
Identify, segment and categorize your customer base to engage with them uniquely:
See how many of your customers are repeat buyers vs. new customers.
Track customer behavior based on purchase frequency, spending amount, and recency of purchase.
Identify, segment and categorize your customer base to engage with them uniquely:
See how many of your customers are repeat buyers vs. new customers.
Track customer behavior based on purchase frequency, spending amount, and recency of purchase.
Create Customer Journeys That Delight
Create Customer
Journeys That Delight
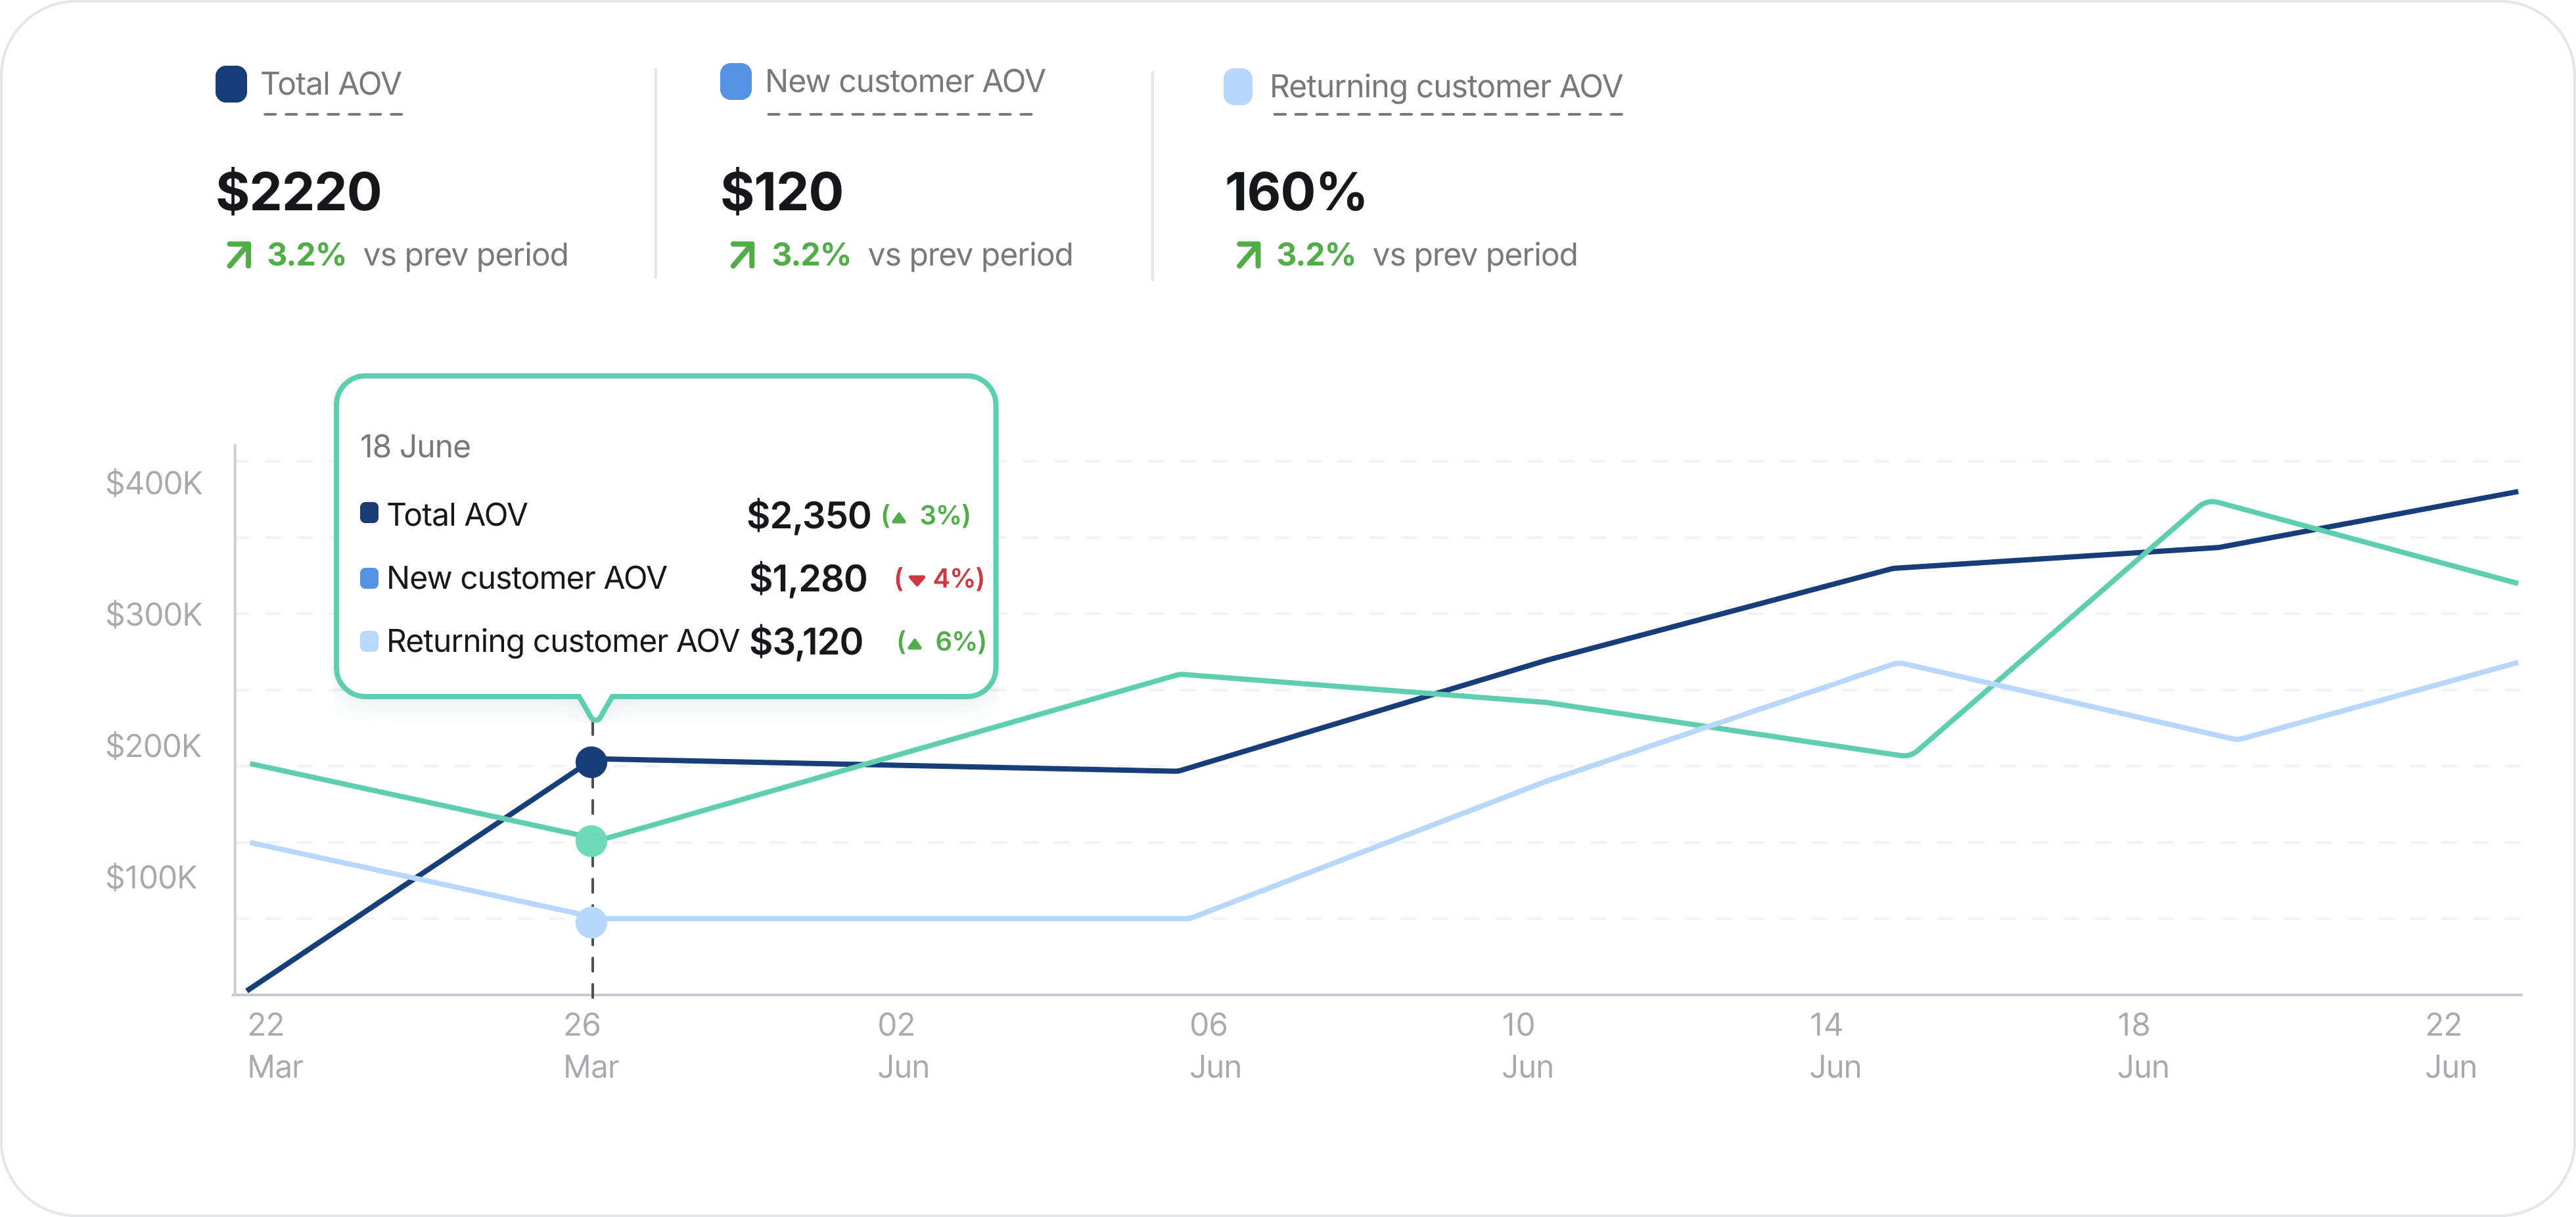
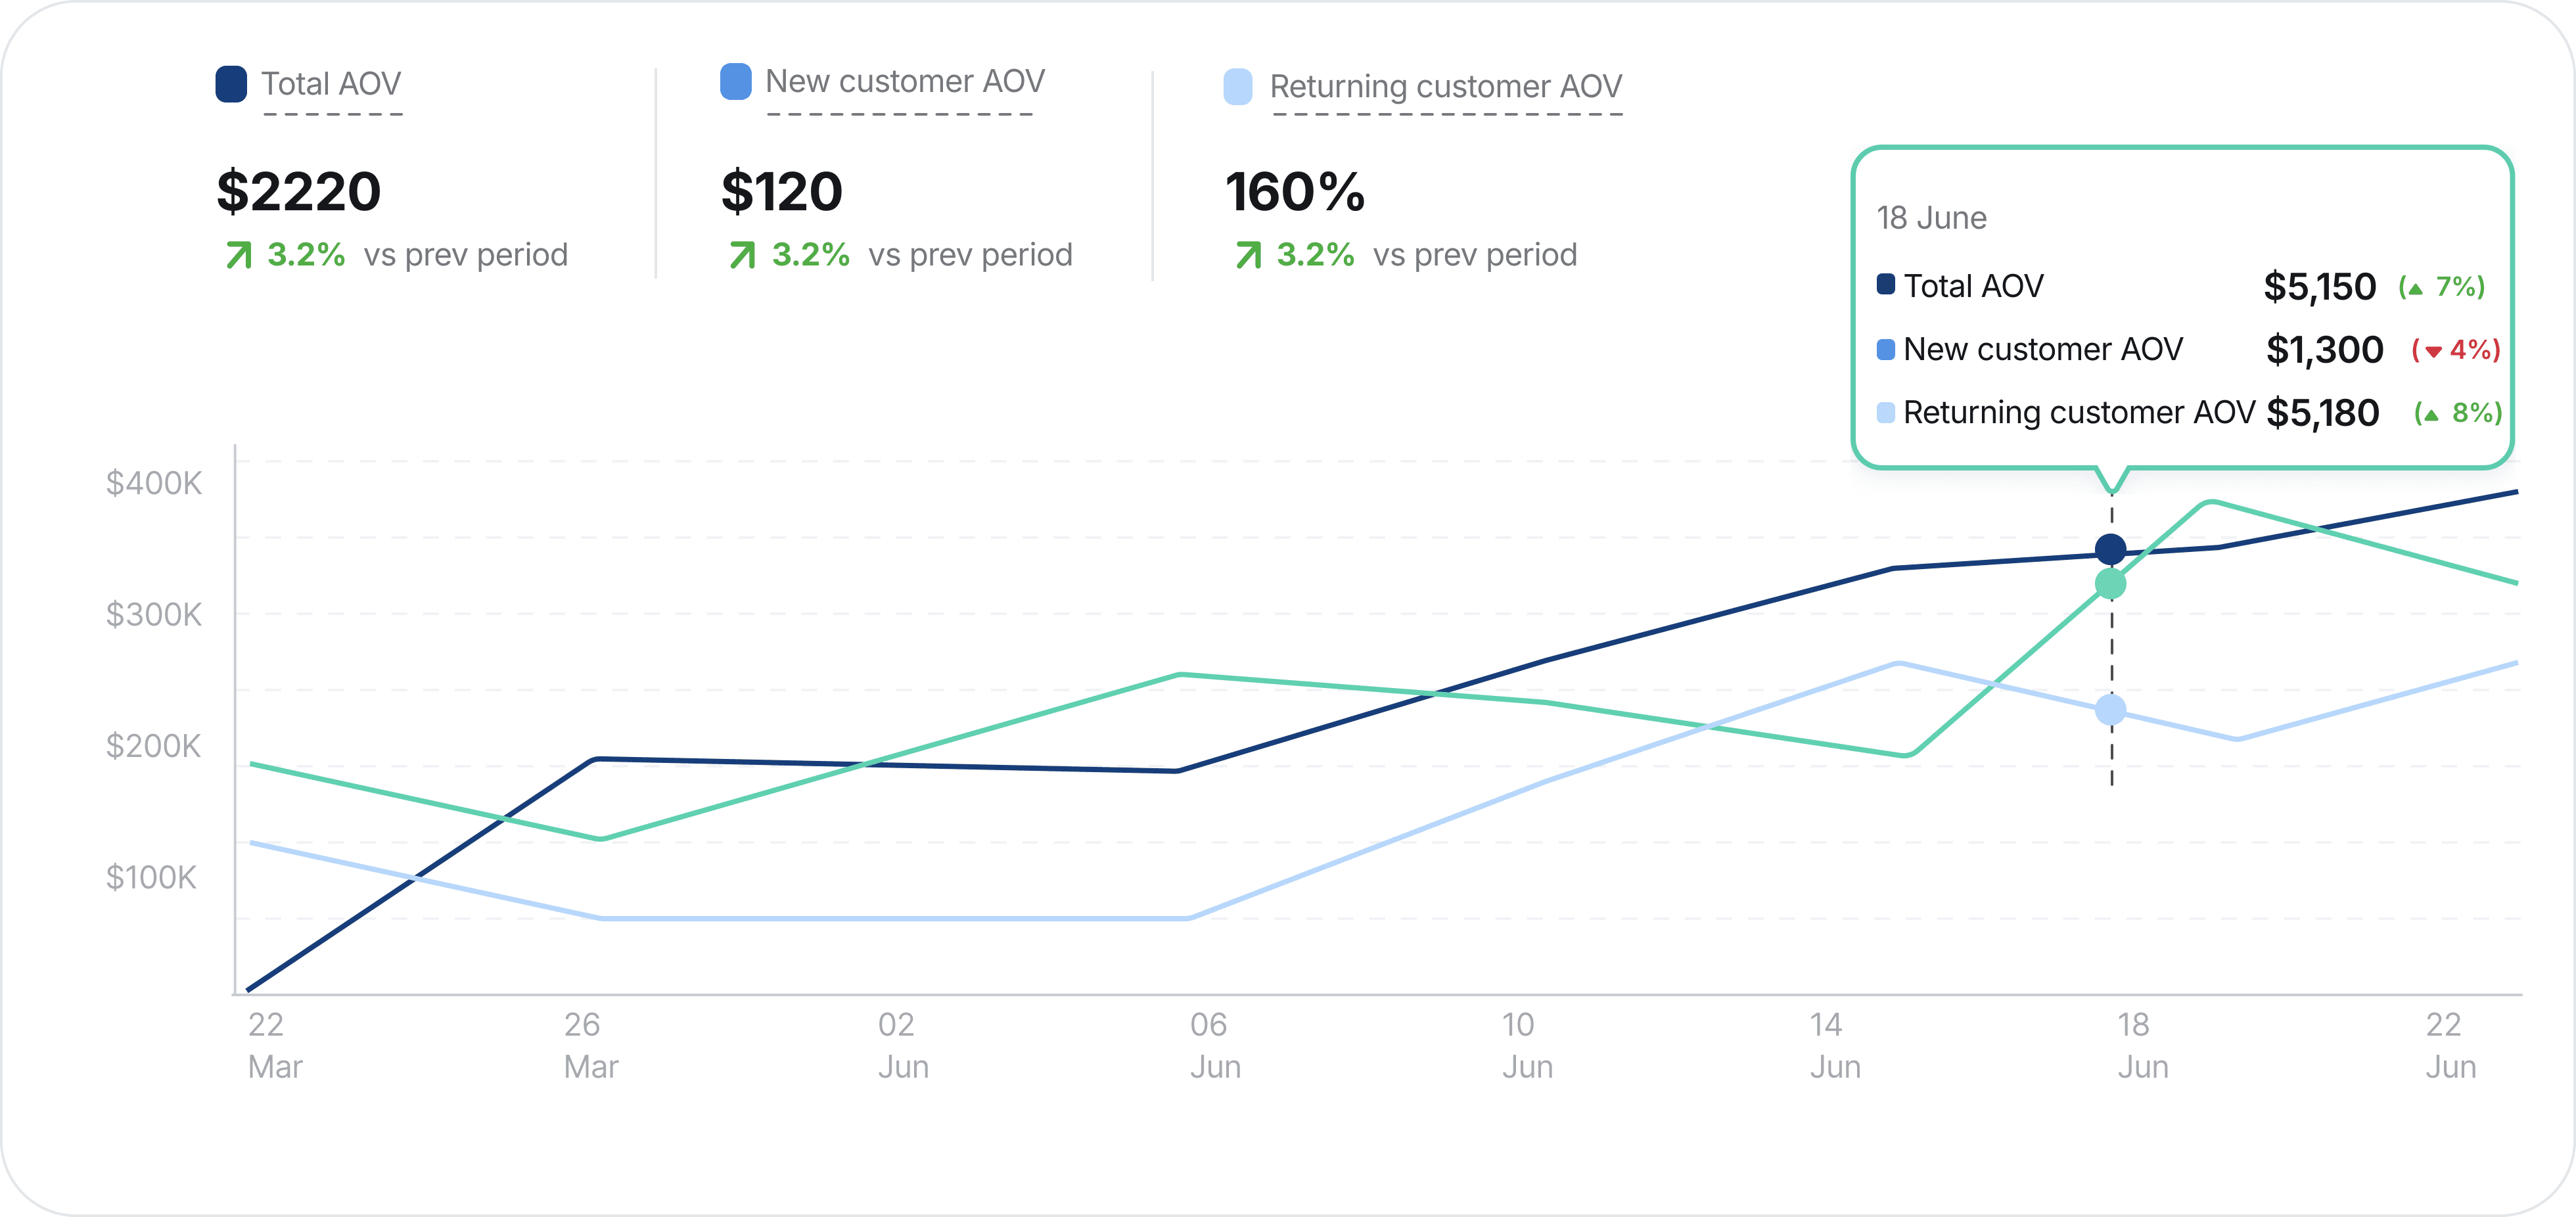
With Customer Metrics, you can zero in on your most profitable customer segments. Whether it's through frequency of purchases or the value they bring, these metrics help you focus on the customers that matter most to your business.
RFM analysis enables users to further refine how you assess customer value.
06 June
Total AOV
( 5%)
$4,200
Returning customer AOV
( 5%)
$4,200
New customer AOV
$2,200
( 4%)
Total AOV
$2220
3.2% vs prev period
New customer AOV
$120
3.2% vs prev period
Returning customer AOV
160%
3.2% vs prev period
06 June
Total AOV
( 5%)
$4,200
Returning customer AOV
( 5%)
$4,200
New customer AOV
$2,200
( 4%)
Total AOV
$2220
3.2% vs prev period
New customer AOV
$120
3.2% vs prev period
Returning customer AOV
160%
3.2% vs prev period


Boost Retention and Maximize LTV with Advanced Retention Cohorts
Boost Retention and Maximize LTV with
Advanced Retention Cohorts
Boost Retention and Maximize
LTV with Advanced Retention Cohorts
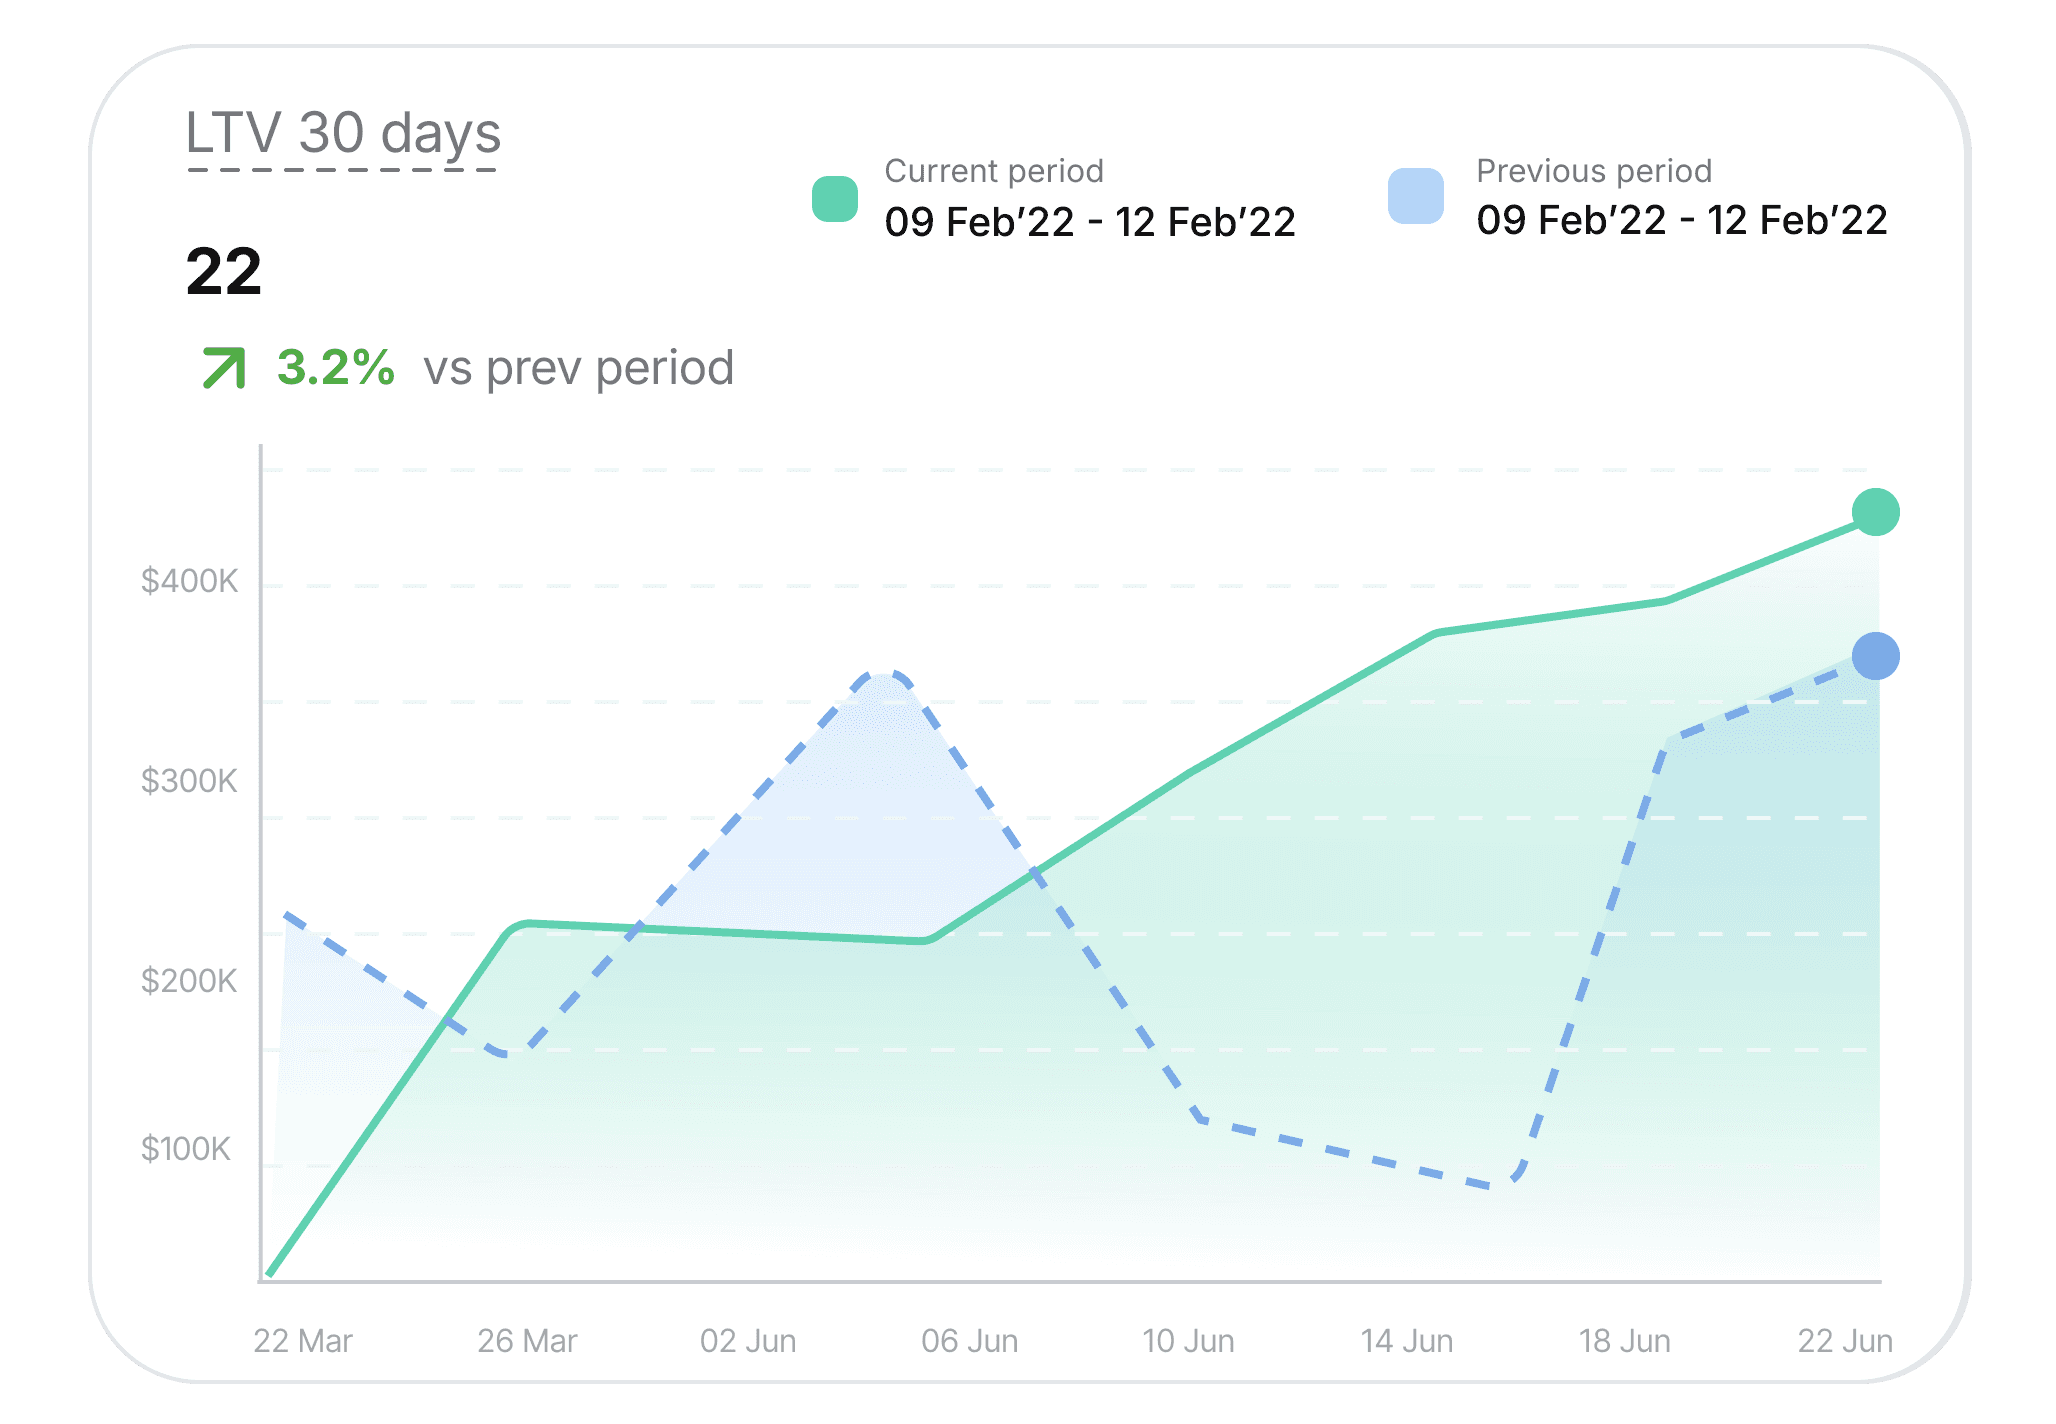
Track your customers over time to understand how retention impacts your bottom line.
Cohort Analysis: Understand customer retention by cohort, which is especially critical for D2C businesses.
LTV Analysis: Measure the lifetime value (LTV) of different customer groups based on their acquisition source—paid vs. organic.
LTV 30 days
22
3.2% vs prev period
$400K
$300K
$200K
$100K
09 Feb’22 - 12 Feb’22
Current period
09 Feb’22 - 12 Feb’22
Previous period
Jan
Jul
Apr
Oct
Feb
Aug
May
Nov
Mar
Sep
jun
Dec
Cohort
1
2
3
4
5
6
7
8
9
10
6%
7%
7%
8%
8%
6%
8%
11%
11%
6%
9%
4%
4%
4%
4%
2%
2%
2%
2%
8%
11%
10%
9%
2%
2%
2%
5%
4%
2%
1%
3%
3%
3%
2%
4%
5%
5%
4%
5%
1%
2%
3%
3%
4%
3%
2%
5%
2%
2%
3%
4%
5%
4%
1%
2%
2%
5%
4%
2%
1%
3%
4%
1%
2%
3%
2%
1%
3%
2%
2%
1%
1%
2%
2%
1%
Month of Acquisition
Returning After How Many Months

Know your acquisition cost vs. customer value
Know your acquisition cost vs. customer value
Know your acquisition cost vs. customer value
With Retention Cohorts, compare the cost per acquisition (CPA) of a cohort to its LTV. Get detailed insights into how much you’re spending to acquire customers and how much value they return over time. You can view this data in absolute numbers or as relative percentages, giving you the flexibility to analyze retention in the way that works best for your business.
With Retention Cohorts, compare the cost per acquisition (CPA) of a cohort to its LTV. Get detailed insights into how much you’re spending to acquire customers and how much value they return over time. You can view this data in absolute numbers or as relative percentages, giving you the flexibility to analyze retention in the way that works best for your business.
With Retention Cohorts, compare the cost per acquisition (CPA) of a cohort to its LTV. Get detailed insights into how much you’re spending to acquire customers and how much value they return over time. You can view this data in absolute numbers or as relative percentages, giving you the flexibility to analyze retention in the way that works best for your business.
Identify High Value Customers and
Maximize Your Profits
Identify High Value Customers
and Maximize Your Profits
Customer Metrics and Retention Cohorts offer the insights you need to focus on your most profitable customers and build long-lasting relationships.

New vs Repeat Buyers
Know how your customers split between first-time and repeat buyers.

Purchase Behavior
Analyze how often customers purchase and how much they spend.

RFM Analysis
Identify high-value customers through Recency, Frequency, and Monetary analysis (coming soon).

LTV vs CPA Comparison
Understand the lifetime value of your customer segments and compare it to their acquisition costs.

Cohort Retention Tracking
Monitor how different customer groups retain over time.

Custom Filters
Filter customers by acquisition channel to measure LTV for paid vs. organic customers.
