Make Smarter
Marketing Decisions

Smarter ads, improved sales, happier customers backed by powerful data

Marketing Metrics and Ad Report provide accurate, actionable insights to optimize your ad spend and boost your ROI

Insights Into The True North Star of
Your Marketing Efforts

Unmatched Expertise and Proven Results

Gain a full picture of your store’s marketing performance with blended metrics that matter:

Track key metrics like ROAS (Return on Ad Spend), CPA (Cost Per Acquisition), POAS (Profit on Ad Spend), and more.

Track key metrics like ROAS (Return on Ad Spend), CPA (Cost Per Acquisition), POAS (Profit on Ad Spend), and more.

Track key metrics like ROAS (Return on Ad Spend), CPA (Cost Per Acquisition), POAS (Profit on Ad Spend), and more.

Understand the true returns from each ad platform, cutting through inaccurate data from ad networks.

Understand the true returns from each ad platform, cutting through inaccurate data from ad networks.

Understand the true returns from each ad platform, cutting through inaccurate data from ad networks.

Eliminate the ‘Guesstimate’,
Plan on Actual Metrics

We have experience with bringing results

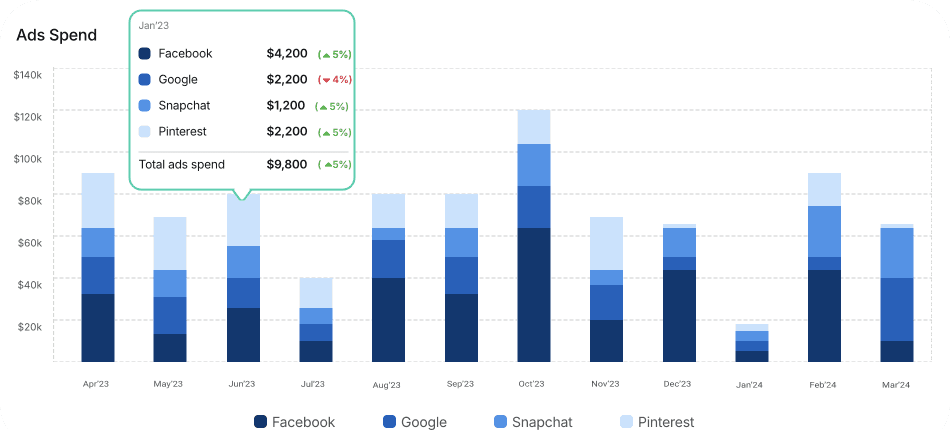
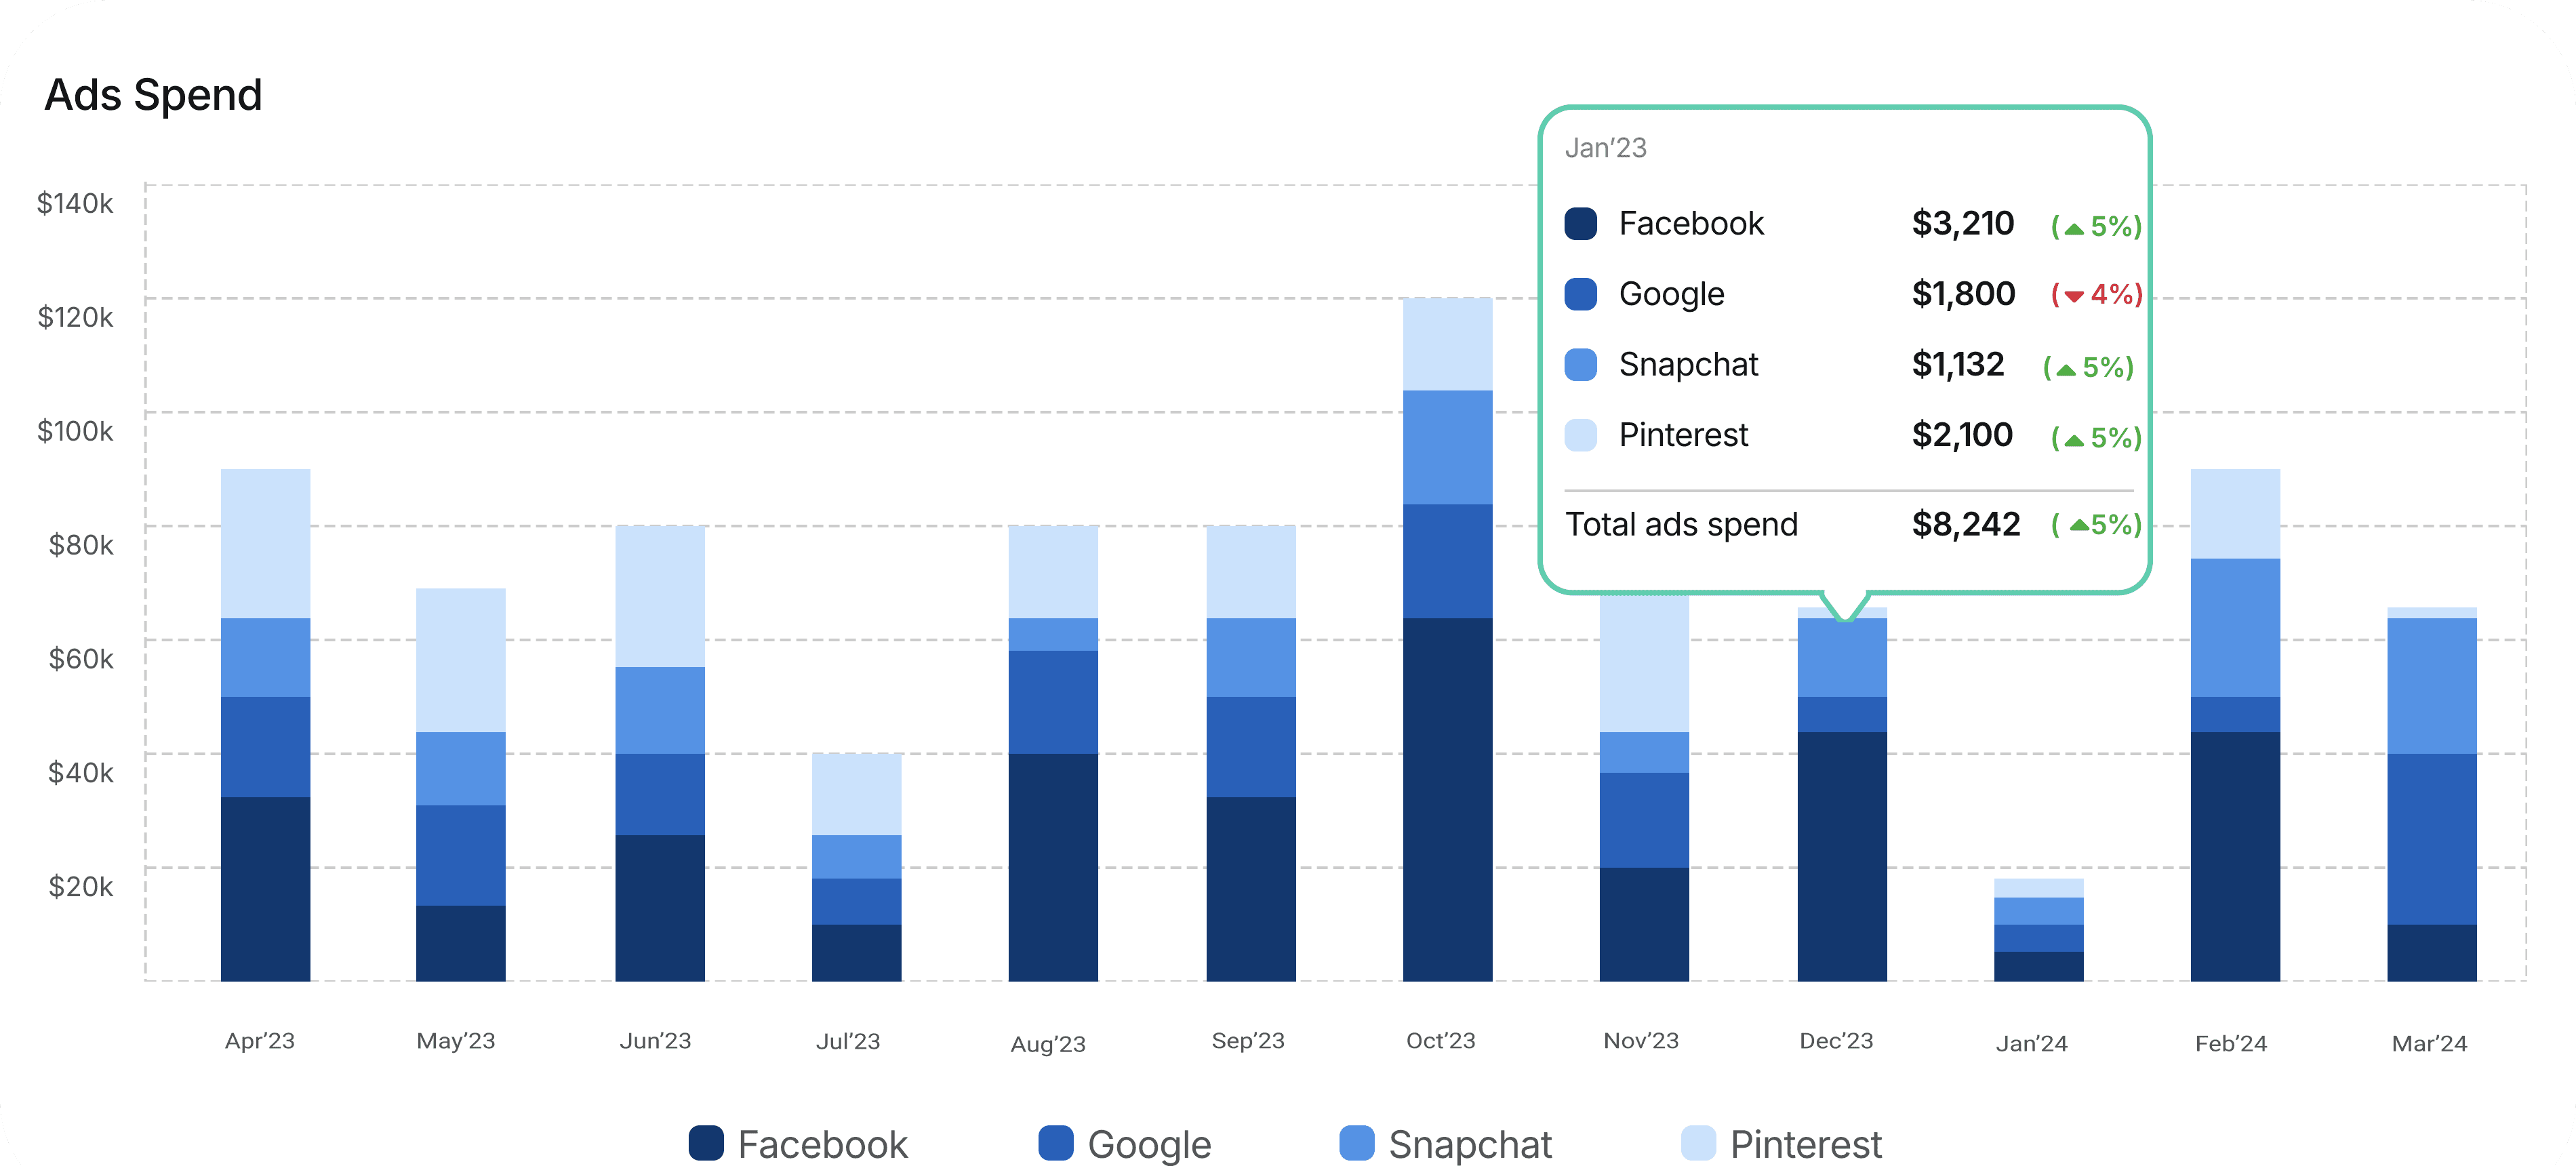
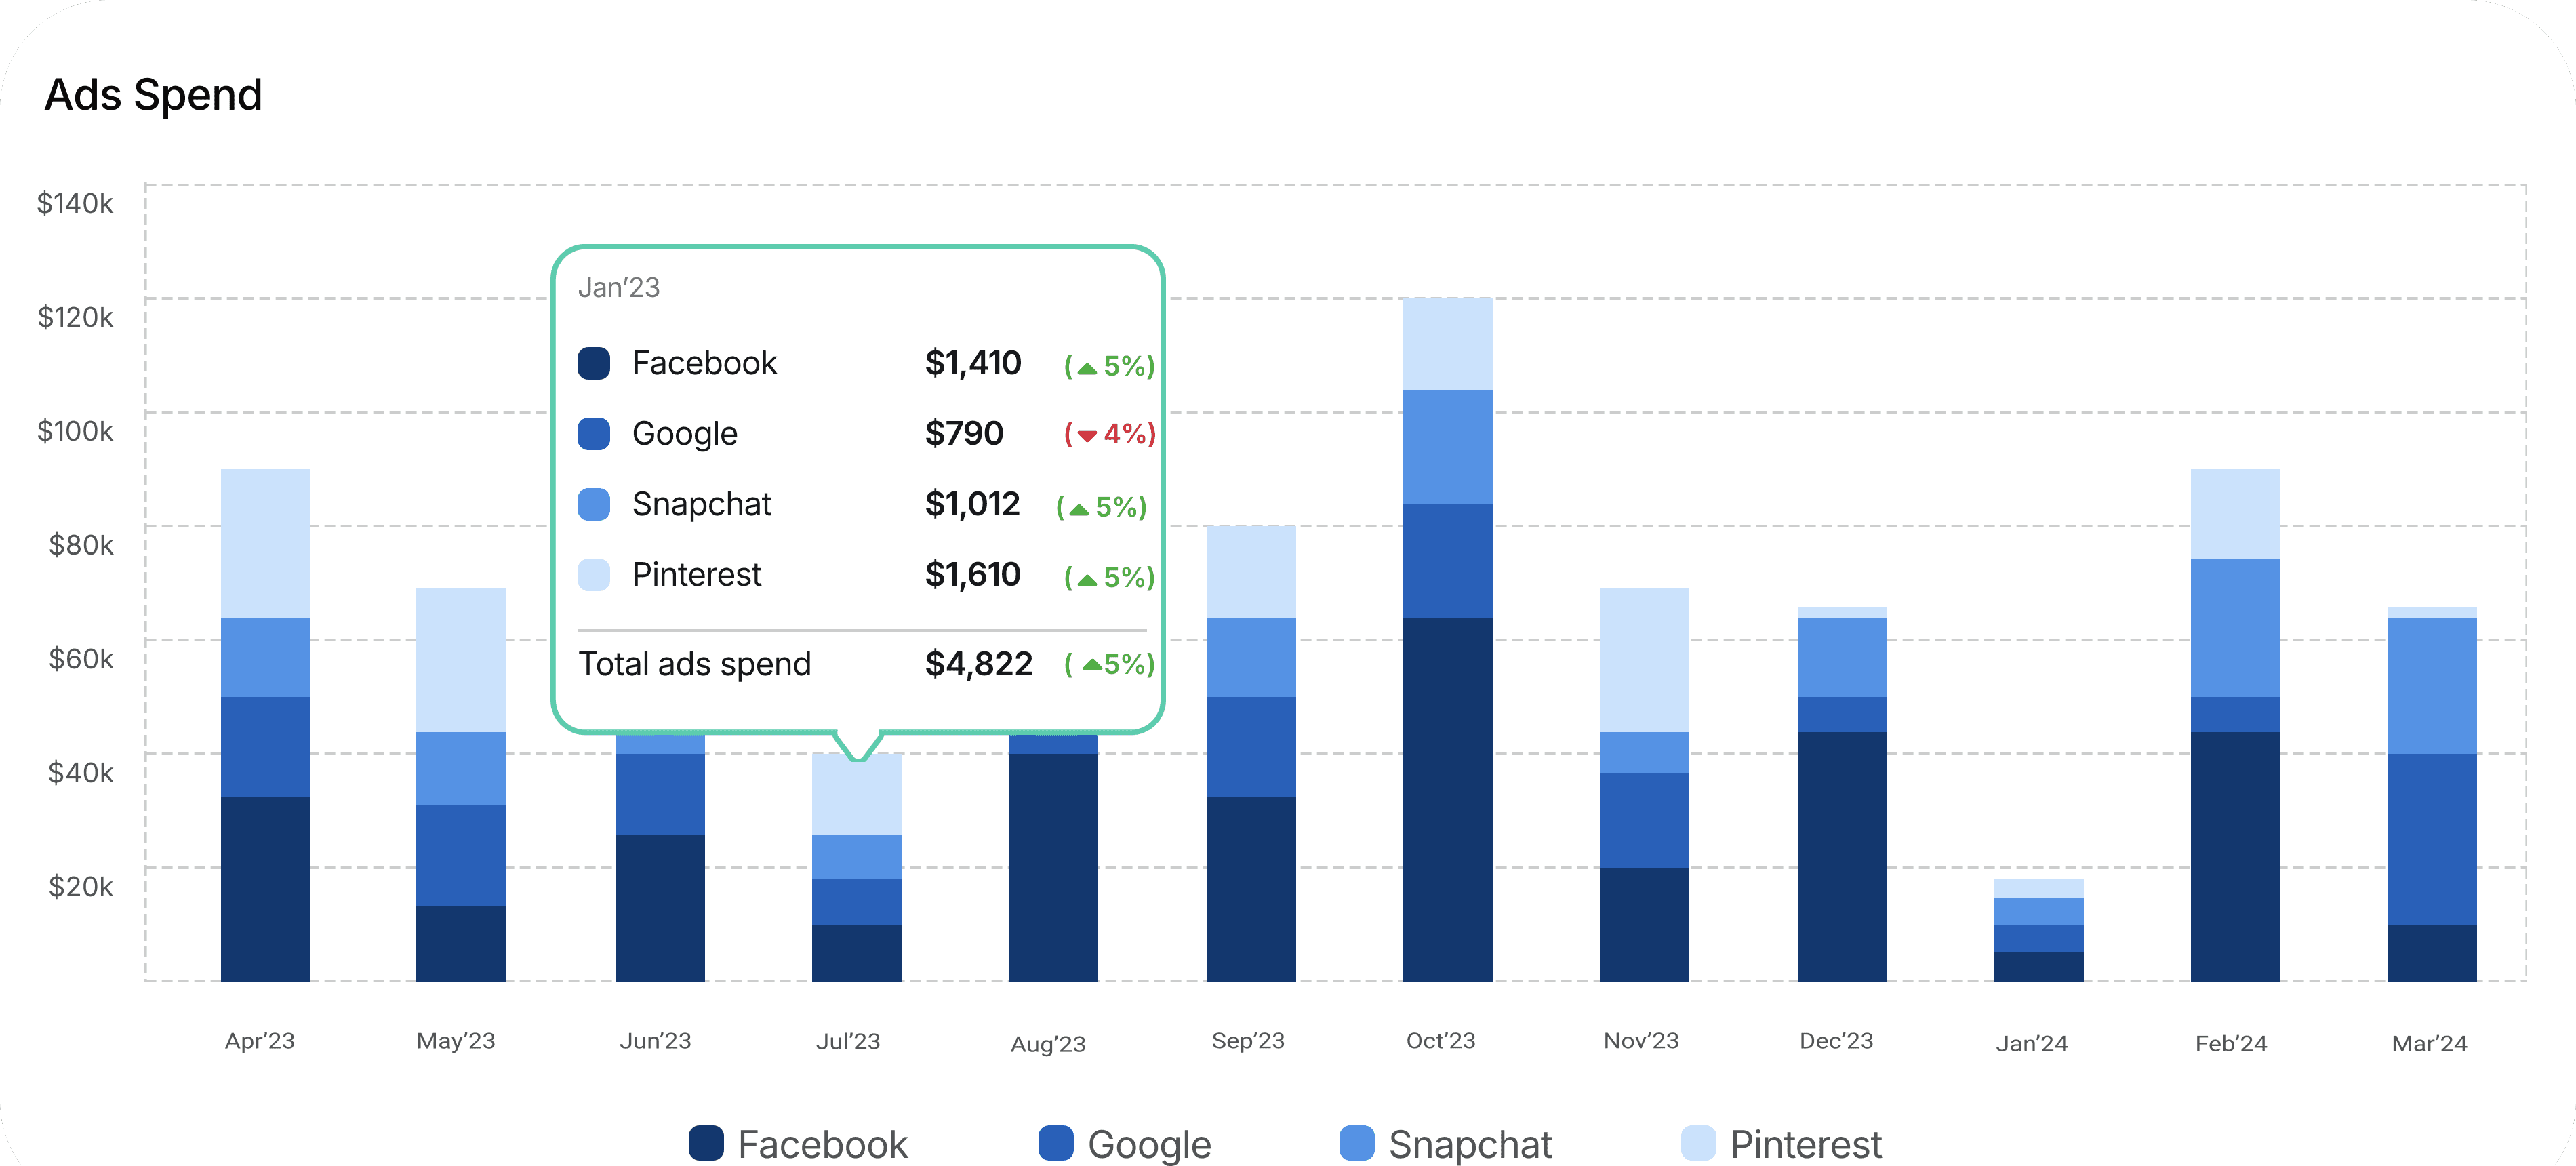
Marketing Metrics gives you more accurate insights than the reports you get from ad platforms. By capturing actual purchases, we calculate the real ROAS, giving you a clearer view of how your ads are performing. This is especially crucial in a post-Apple ATT (App Tracking Transparency) world, where ad platform data has become less reliable. Use these insights to confidently direct your marketing budget for maximum returns.

Jan’23

Facebook

$4,200

( 5%)

( 5%)

Snapchat

$1,200

( 5%)

Pinterest

$2,200

( 5%)

Google

$2,200

( 4%)

$9,800

( 5%)

Total ads spend

Ads Spend

$120k

$100k

$80k

$60k

$40k

$20k

$140k

Facebook

Google

Snapchat

Pinterest

Value Drivers Across
Ad Platforms with Ad Report

We have experience with bringing results

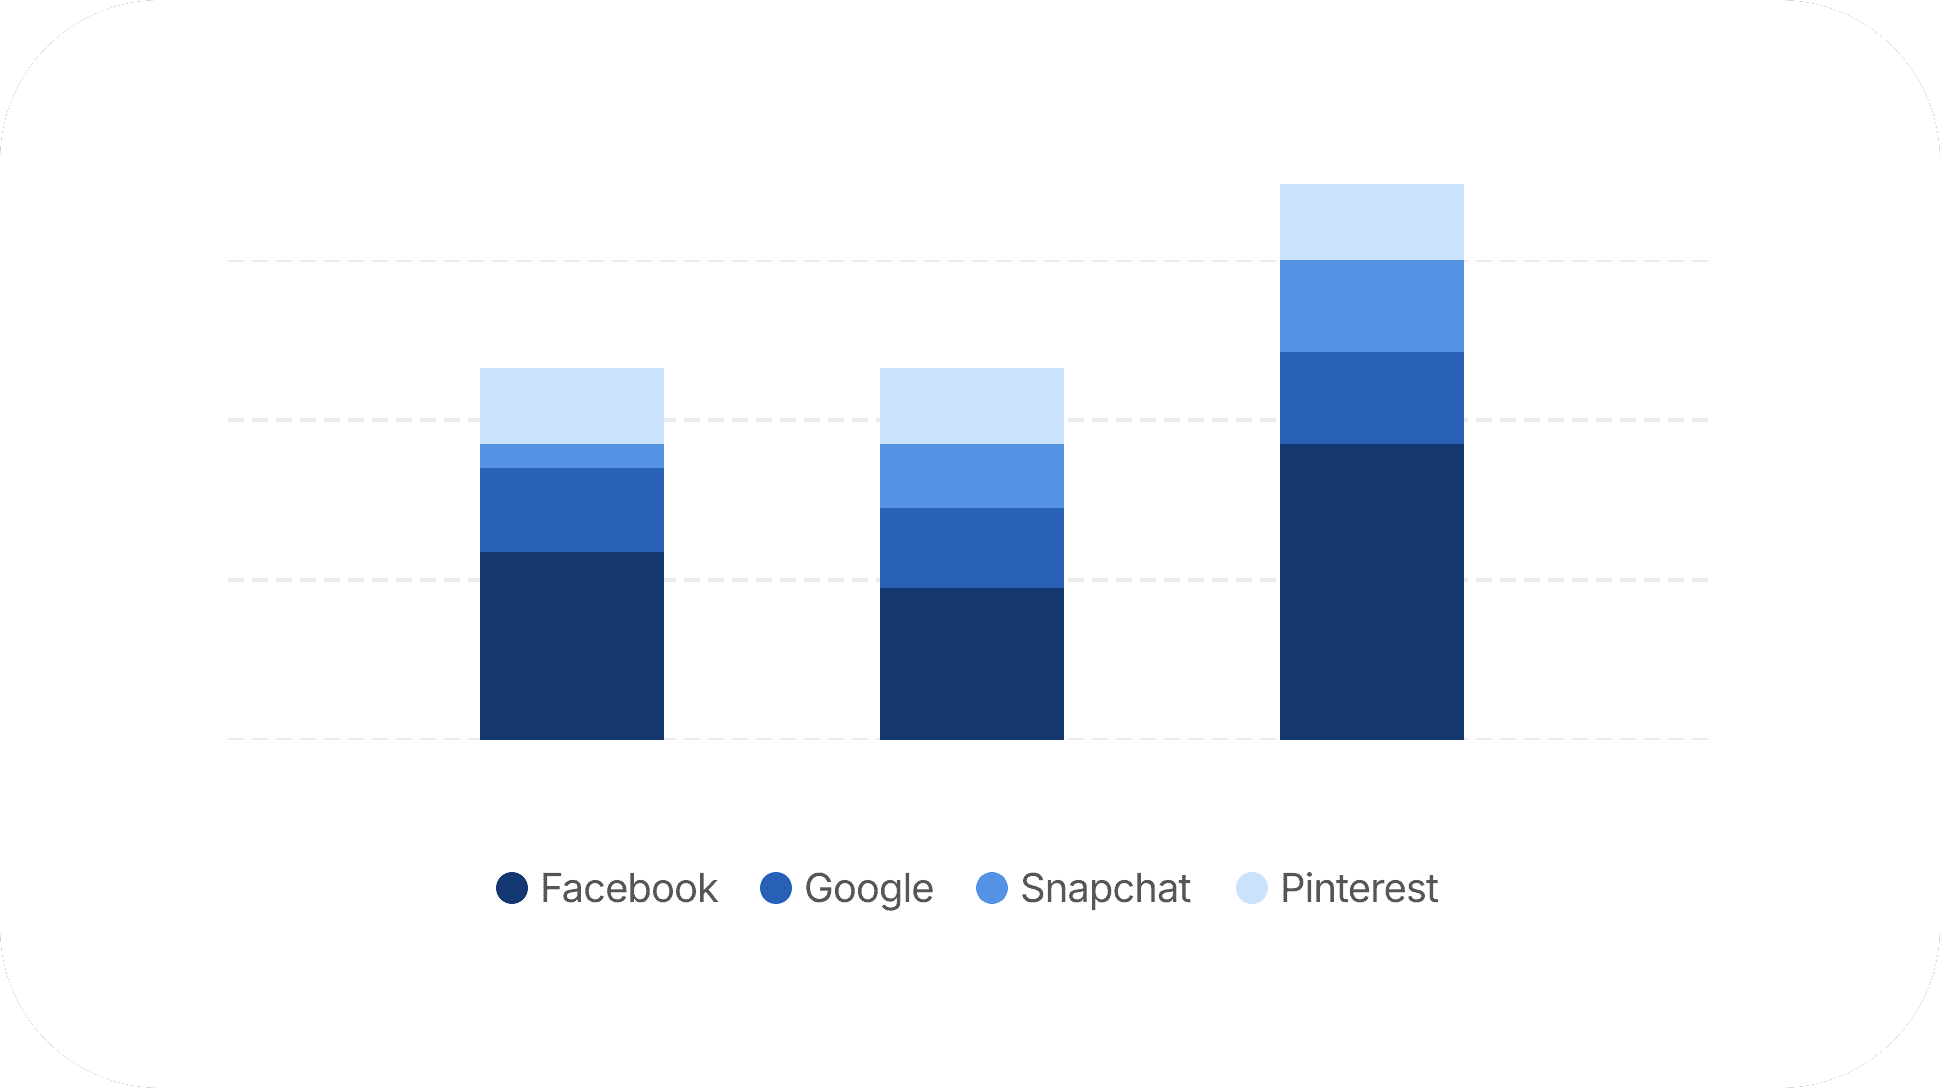
Go deeper into the performance of each individual ad platform with Ad Report:

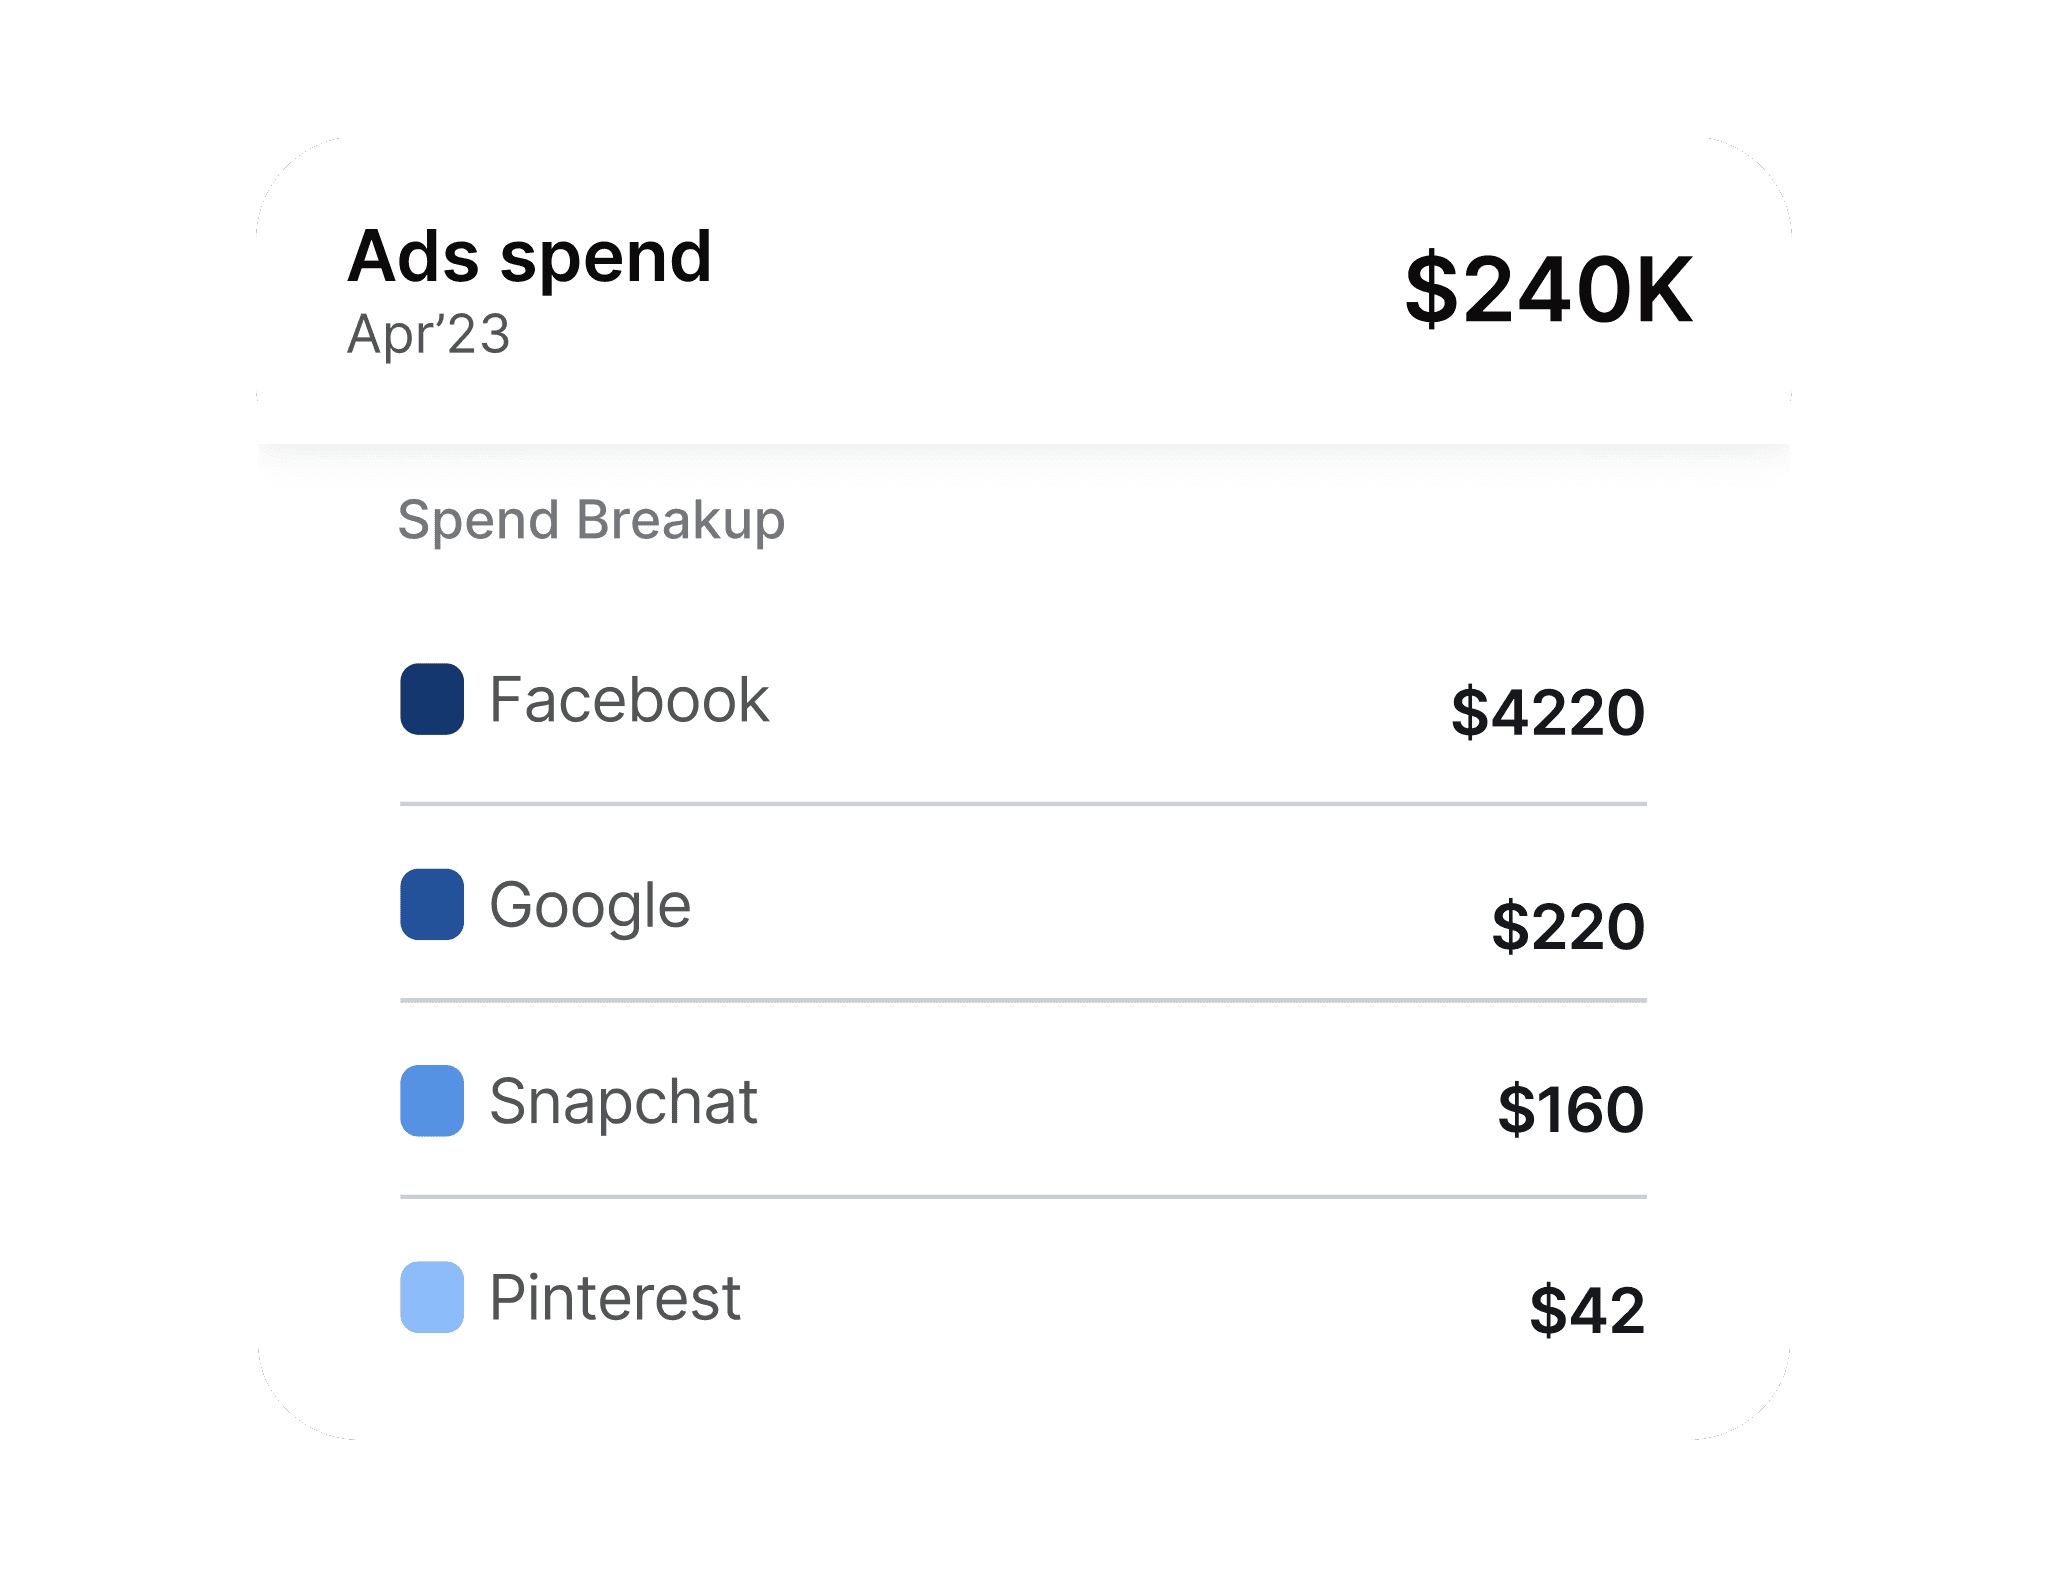
Drill down into platform-specific metrics to see which ad channels deliver the highest revenue for the lowest cost.

Jan’23

Facebook

$4,200

( 5%)

Facebook

Google

Snapchat

Pinterest

Jan’23

Facebook

$4,200

( 5%)

Facebook

Google

Snapchat

Pinterest

Jan’23

Facebook

$4,200

( 5%)

Facebook

Google

Snapchat

Pinterest

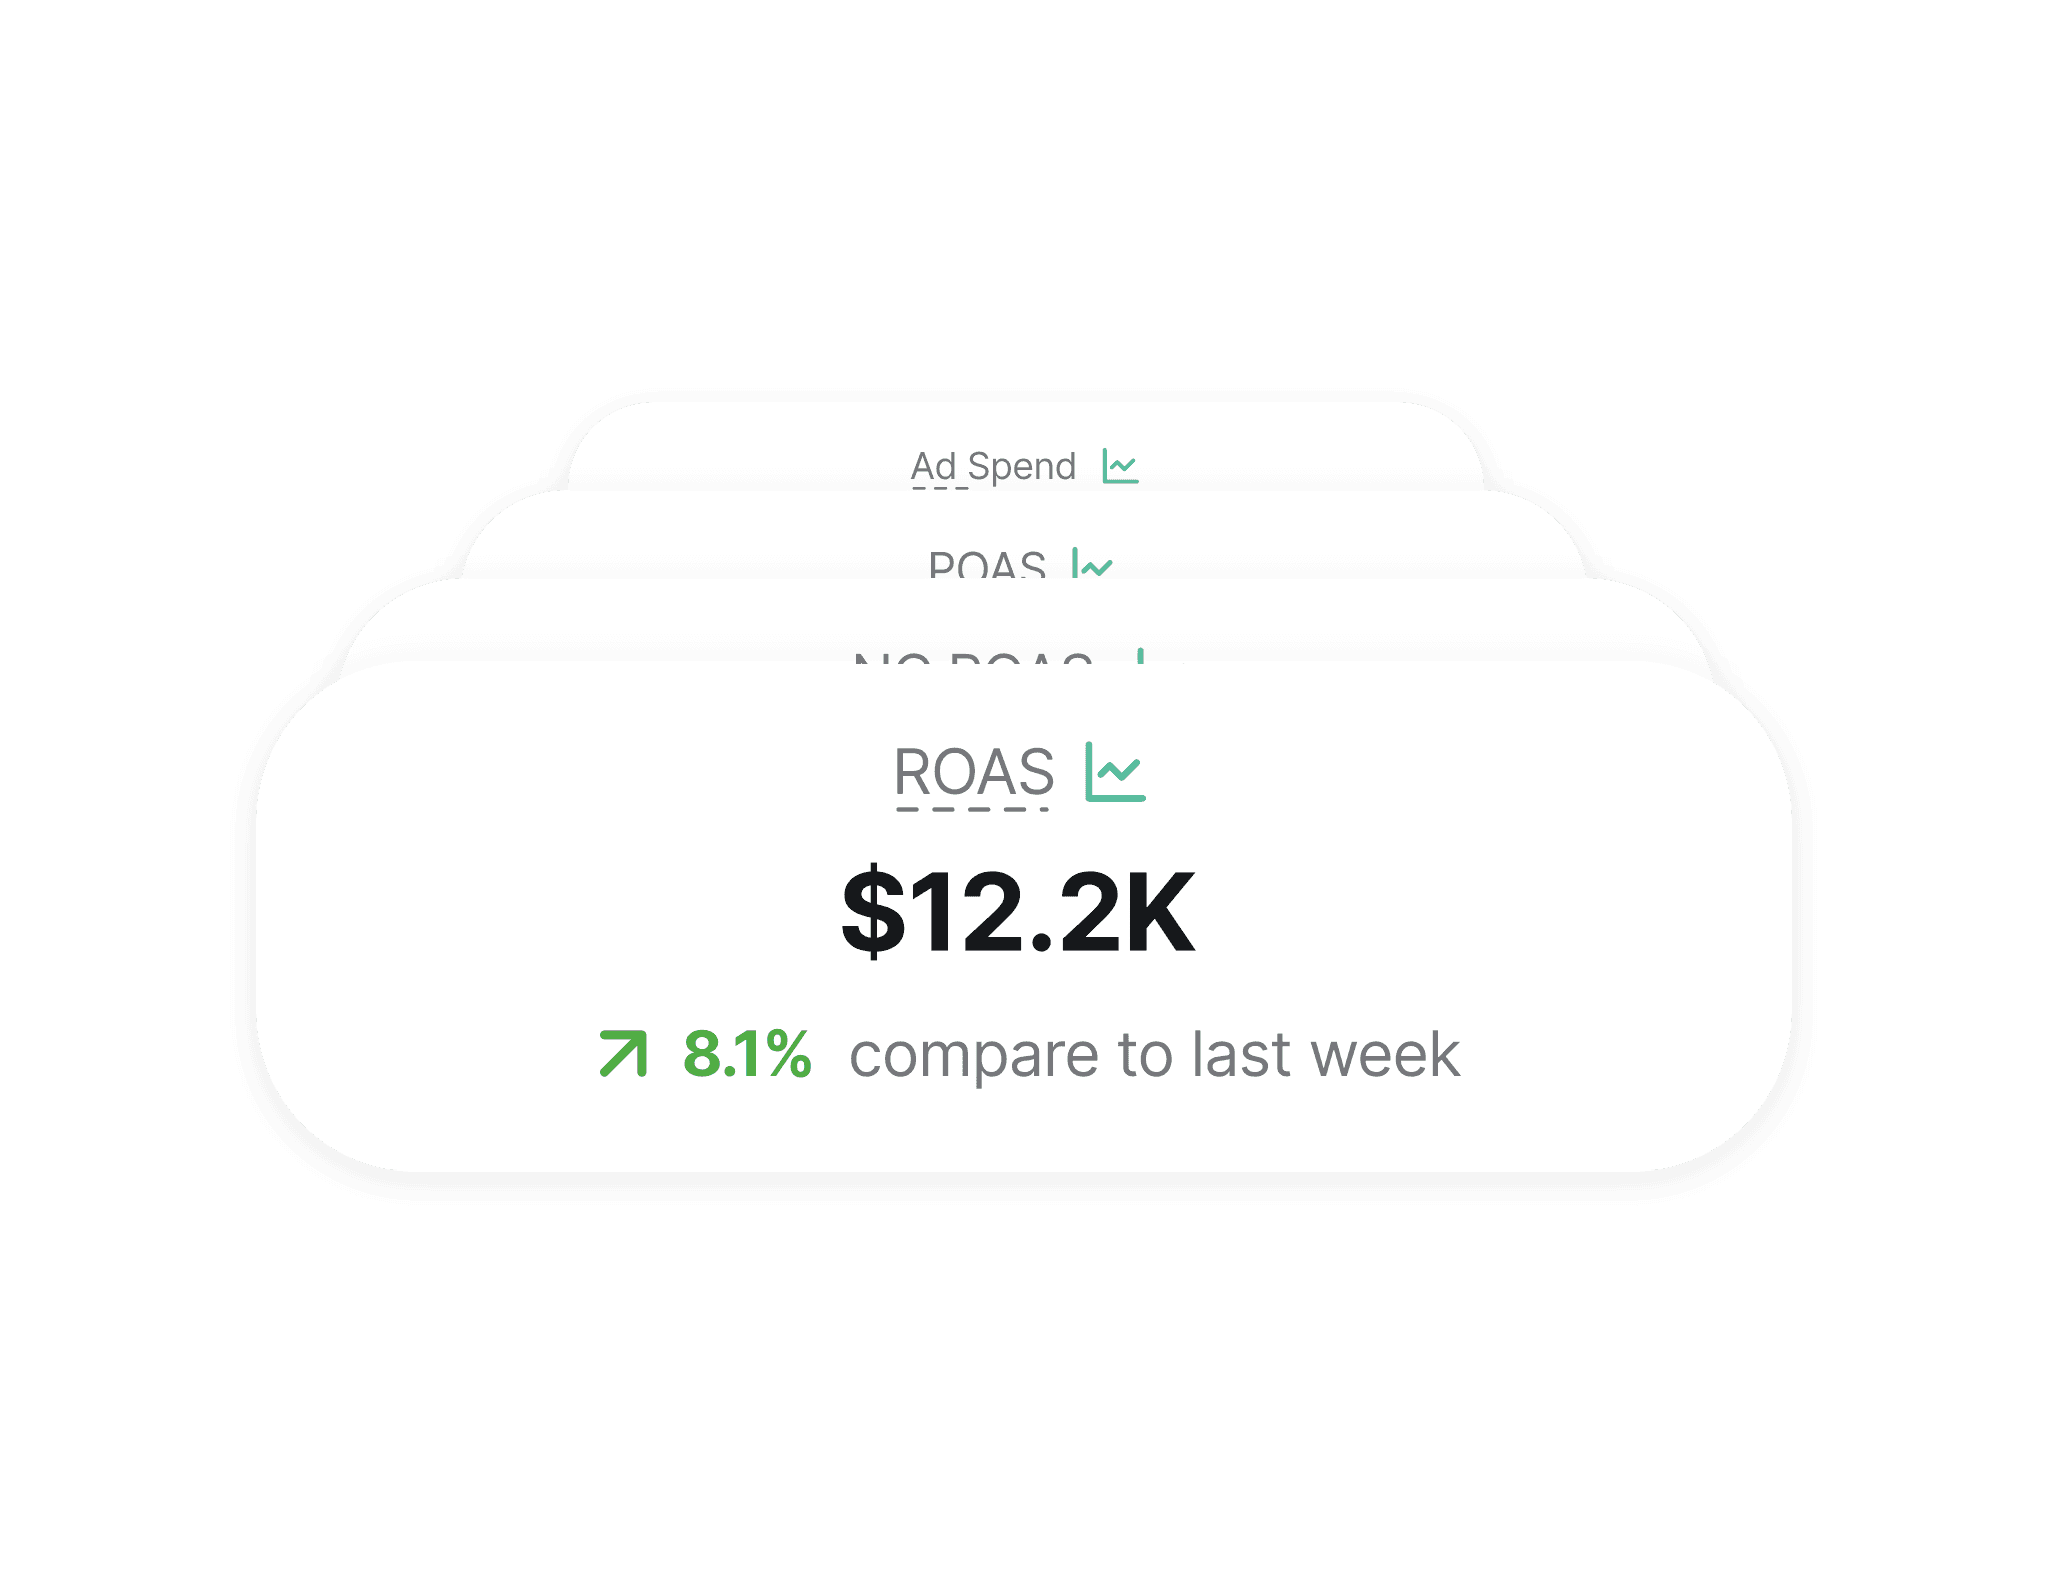
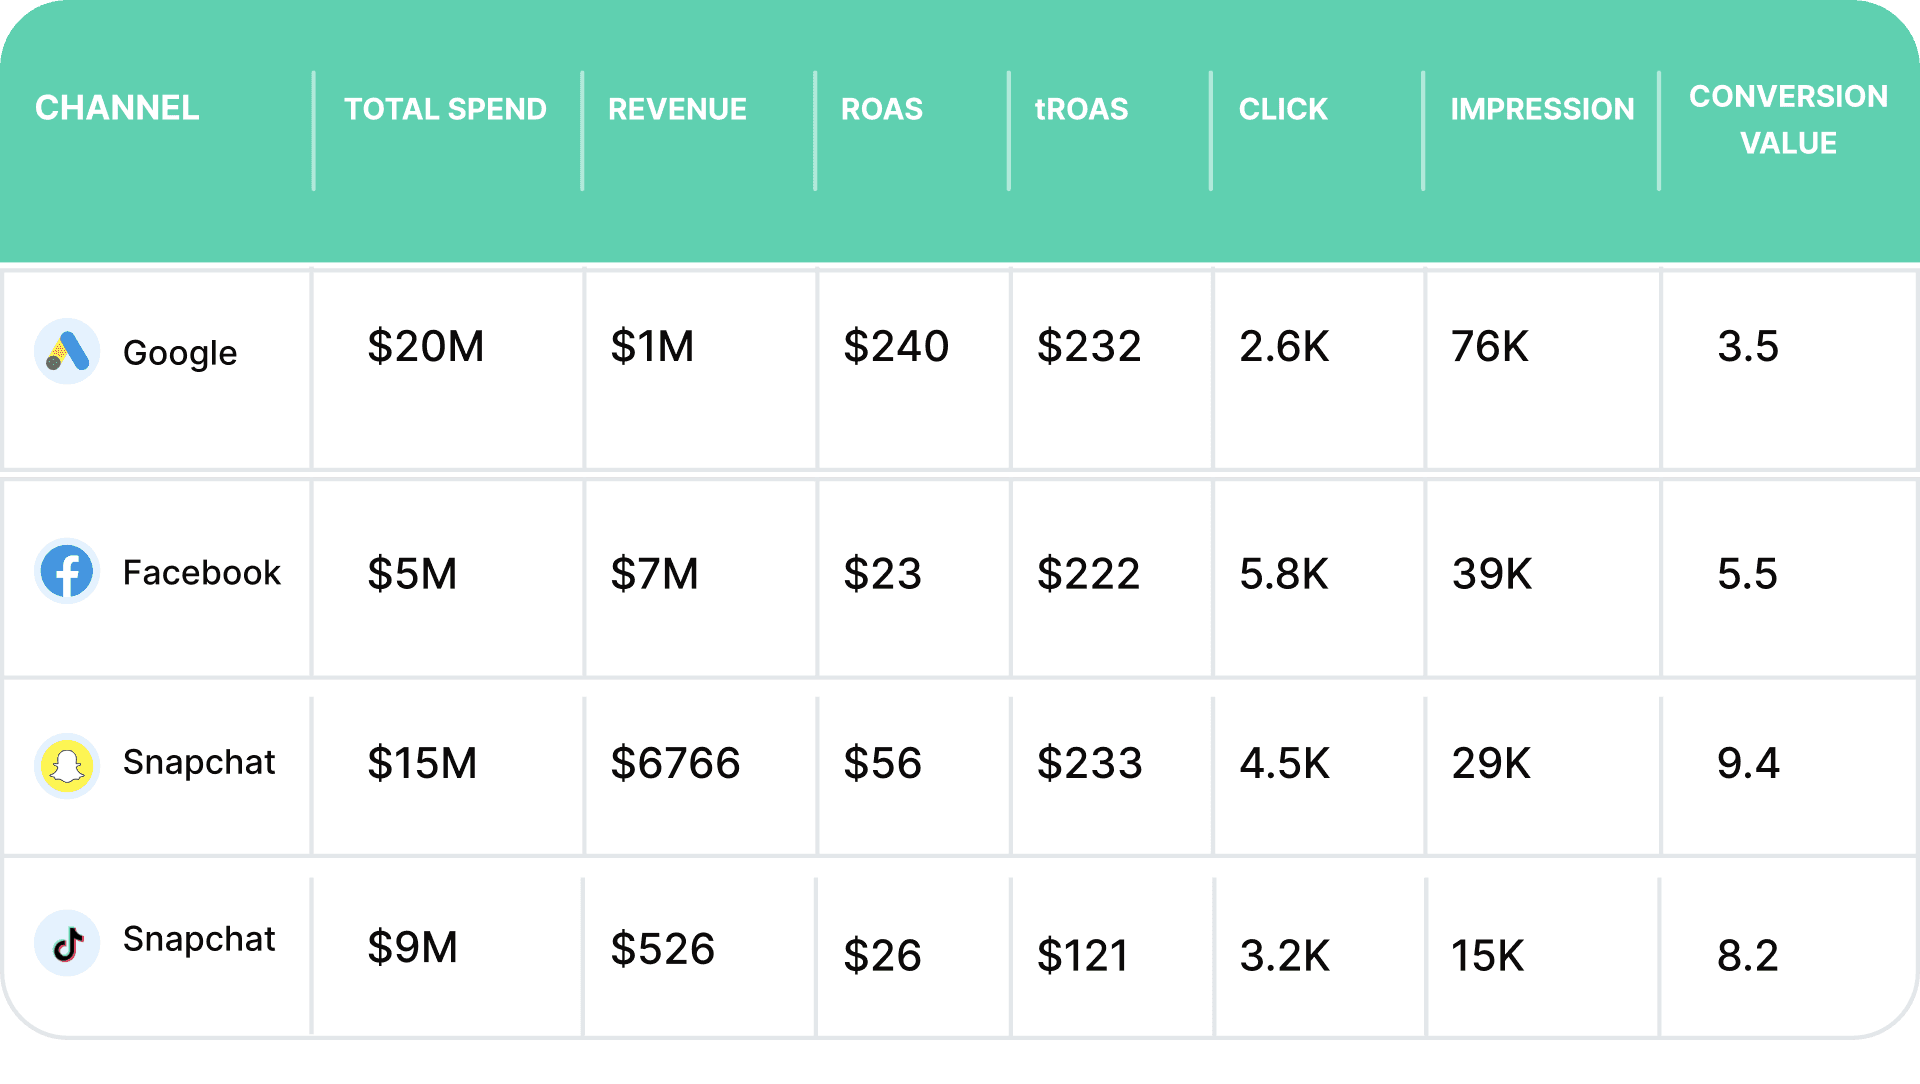
Compare Bloom’s ROAS calculations (based on actual sales) to the numbers reported by the ad platforms themselves.

8.1% compare to last week

ROAS

$12.2K

3.2% compare to last week

Ad Spend

$25.42K

8.1% compare to last week

ROAS

$12.2K

3.2% compare to last week

Ad Spend

$25.42K

8.1% compare to last week

ROAS

$12.2K

3.2% compare to last week

Ad Spend

$25.42K

Stay Ahead of Inflated Metrics

Stay Ahead of Inflated Metrics

Stay Ahead of Inflated Metrics

Ad platforms often overstate their ROAS to make their performance appear better. With Ad Report, you get an unbiased view based on actual sales data, so you can identify the platforms truly delivering value and adjust your spend accordingly.

Ad platforms often overstate their ROAS to make their performance appear better. With Ad Report, you get an unbiased view based on actual sales data, so you can identify the platforms truly delivering value and adjust your spend accordingly.

Ad platforms often overstate their ROAS to make their performance appear better. With Ad Report, you get an unbiased view based on actual sales data, so you can identify the platforms truly delivering value and adjust your spend accordingly.

Steer Your Marketing Efforts Based on
Your Business Needs

Unmatched Expertise and Proven Results

Marketing Metrics and Ad Report give you the tools to make informed decisions and maximize the impact of your marketing efforts.

Blended
Metrics

Get an all-in-one view of your marketing performance across platforms.

Accurate
ROAS & POAS

Make decisions based on real revenue, not inflated ad platform reports.

Benchmarking

Compare the performance of each ad platform to see which generates the best returns.

Cost vs Revenue

Navigate quickly through high-margin products and remove low-margin items from your sales inventory.

Platform-Specific Metrics

Drill down into the details of each ad platform to optimize your spend.

Post-ATT Adaptation

Track accurate marketing metrics even in the wake of Apple’s ATT changes.

Optimize Your
Ad Spend with Real Metrics