


Shopify merchants sold $14.6 billion over Black Friday Cyber Monday 2025, up 27% from 2024 and a record for the third year running. More than 81 million shoppers bought from Shopify stores that weekend, and sales peaked at $5.1 million per minute on Black Friday.
These Shopify BFCM statistics show how big the weekend has become, what sells, how much shoppers spend and how deep discounts go. They are revenue numbers, though. The last section covers what they leave out, and why the number that decides whether BFCM was worth it is profit.
Shopify BFCM statistics at a glance
| Statistic | BFCM 2025 |
|---|---|
| Total sales (GMV) | $14.6 billion |
| Growth vs 2024 | 27% (24% in constant currency) |
| Shoppers who bought from Shopify stores | 81+ million |
| Peak sales per minute | $5.1 million, at 12:01 p.m. EST on Black Friday |
| Average cart | $114.70 |
| Merchants with their highest-selling day ever | 94,900+ |
| Entrepreneurs who made their first sale | 15,800+ |
| Cross-border share of orders | 16% |
| Orders placed with Shop Pay | 32% |
| Top-selling countries | US, UK, Australia, Germany, Canada |
Source: Shopify, December 2025.
How have Shopify BFCM sales grown year by year?
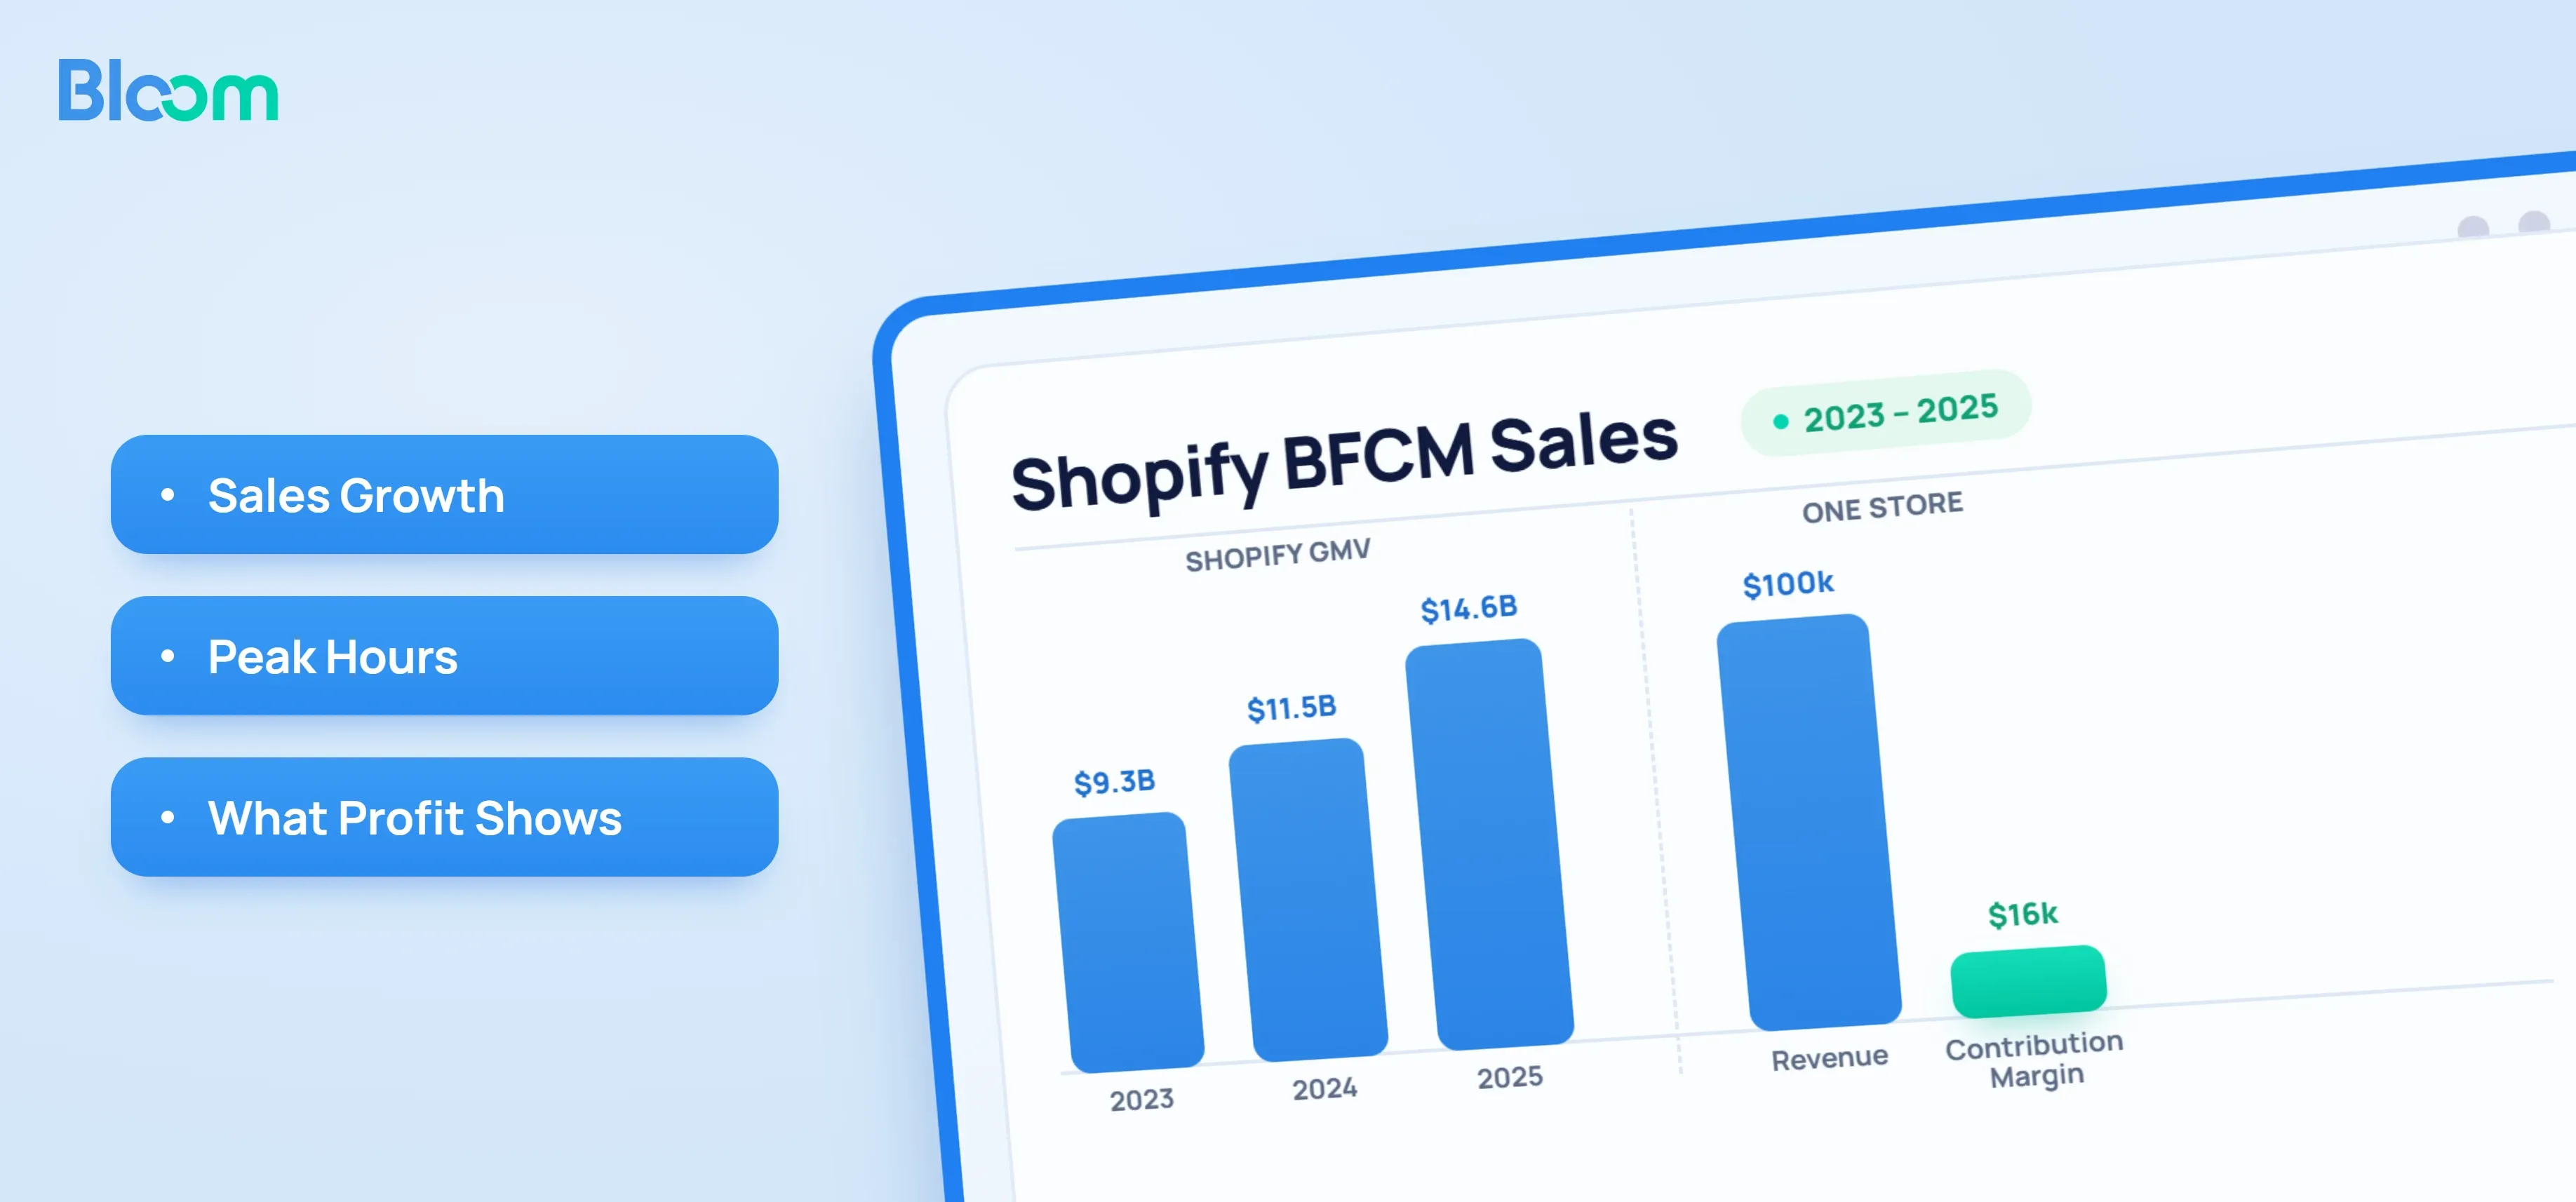
Shopify BFCM sales grew from $9.3 billion in 2023 to $14.6 billion in 2025, a 57% rise in two years. Each year set a new record, with growth of 24%, 24% and 27%.
| Statistic | 2025 | 2024 | 2023 |
|---|---|---|---|
| Total sales (GMV) | $14.6 billion | $11.5 billion | $9.3 billion |
| Growth vs prior year | 27% | 24% | 24% |
| Shoppers | 81+ million | 76+ million | 61+ million |
| Peak sales per minute | $5.1 million | $4.6 million | $4.2 million |
| Average cart | $114.70 | $108.56 | $108.12 |
| Merchants with their best day ever | 94,900+ | 67,000+ | 55,000+ |
| First-time sellers | 15,800+ | 16,500+ | 17,500+ |
| Cross-border share of orders | 16% | 16% | 15% |
Sources: Shopify 2025, Shopify 2024, Shopify 2023, Smallbiztrends on 2023 cross-border share.
Two trends stand out. Sales grew faster than the number of shoppers, so each shopper spent more. And the number of merchants with a record day rose by more than 70% between 2023 and 2025, so more stores are competing for the same weekend.
Why the yearly totals are not perfectly comparable
Shopify reports gross merchandise volume (GMV): the total value of orders, including shipping, duties and taxes, net of refunds at the time of reporting. Shopify notes that its methodology can change from year to year, so prior-year results are not directly comparable. In 2025, for example, it switched to counting shoppers by unique buyer emails.
Treat the trend as reliable and small year-to-year differences with caution.
When do Shopify BFCM sales peak?
On Shopify, the busiest minute of BFCM has landed at 12:01 p.m. EST on Black Friday three years in a row: $4.2 million per minute in 2023, $4.6 million in 2024 and $5.1 million in 2025. In 2023, Black Friday alone brought in $4.1 billion of the weekend's $9.3 billion (BetaKit).
Across all US online retail, the picture is slightly different. Cyber Monday is still the biggest single online shopping day, but Black Friday is growing faster.
| US online spend, Cyber Week 2025 | Amount | Growth vs 2024 |
|---|---|---|
| Thanksgiving | $6.4 billion | 5.3% |
| Black Friday | $11.8 billion | 9.1% |
| Saturday and Sunday | $11.8 billion | 8.7% |
| Cyber Monday | $14.25 billion | 7.1% |
| Cyber Week total | $44.2 billion | 7.7% |
Source: Adobe, December 2025. Adobe tracks US online retail across all platforms, not only Shopify.
2025 was the second year running that Black Friday grew faster than Cyber Monday, as earlier deals pulled spending forward. On Cyber Monday, US spending peaked between 8 p.m. and 10 p.m., at $16 million per minute.
What this means for your store: have someone watching checkout, stock and ad spend around midday Eastern time on Black Friday, when Shopify traffic peaks. Plan a second watch for Monday evening, when last-chance buyers arrive.
What sells best on Shopify during BFCM?
Clothing, beauty and fitness products have led Shopify BFCM for three years. In 2025, Shopify's hottest categories were cosmetics, clothing tops and pants, activewear, and fitness and nutrition.
| Year | Shopify's top BFCM categories |
|---|---|
| 2025 | Cosmetics, clothing tops and pants, activewear, fitness and nutrition |
| 2024 | Clothing tops, cosmetics, fitness and nutrition, pants, activewear |
| 2023 | Apparel and accessories, health and beauty, home and garden |
Sources: Shopify 2025, 2024, 2023.
Across all US online retail, the mix is different. On Cyber Monday 2025, electronics, apparel and furniture drove 57% of US online spend, according to Adobe. Shopify's list leans toward DTC categories: products people buy for themselves, use up and buy again.
Best-selling is not the same as most profitable
Shopify ranks categories by sales, not margin. The top categories carry very different profit profiles:
- Apparel sells in volume but carries high return rates, so holiday returns land after the sales spike.
- Beauty and supplements usually have strong product margins, but they compete in some of the most expensive ad auctions of the year.
- Consumables like skin care and supplements can turn a discounted first order into repeat full-price orders, which makes the discount worth more.
A seller in a top category can post a record sales day and still keep less profit than last year. See Top-Selling Products on Shopify for Black Friday and the most profitable products to sell on Shopify.
How much do shoppers spend per order during BFCM?
The average Shopify BFCM cart was $114.70 in 2025, up from $108.56 in 2024 and $108.12 in 2023. That is a 6% rise in two years, even though discounts lower the price of each item.
Part of the rise comes from shoppers trading up. Adobe found that during the 2025 season, the share of units sold for the most expensive goods rose 19% across US online retail, led by electronics, sporting goods and appliances (Adobe).
How shoppers pay is shifting too:
- Shop Pay handled 32% of Shopify BFCM orders in 2025, and Shop Pay sales grew 39% year over year (Shopify).
- Buy Now Pay Later drove $1.03 billion of US online spend on Cyber Monday 2025 alone (Adobe).
- Mobile carried 57.5% of US online sales on Cyber Monday 2025, up from 41.4% in 2020.
- Cross-border orders made up 16% of all Shopify BFCM orders in 2025.
What this means for your store: a higher cart value is the cheapest lever you have. Bundles, tiered offers and free-shipping thresholds raise order value without deepening the discount on every item.
How deep are BFCM discounts?
On Cyber Monday 2025, US online discounts peaked at 31% off list price for electronics and 25% for apparel, according to Adobe. Discounts eased after Cyber Week but stayed in place into early December.
| Category | Peak discount, Cyber Monday 2025 |
|---|---|
| Electronics | 31% |
| Toys | 28% |
| Apparel | 25% |
| Computers | 23% |
| Televisions | 22% |
| Furniture | 19% |
| Appliances | 19% |
| Sporting goods | 17% |
Source: Adobe, US online retail. Discounts are measured against listed prices.
Are BFCM discounts real?
Across the market, yes. Individual deals are another matter. UK consumer group Which? tracked 214 Black Friday deals at seven large UK retailers every day for six months either side of the event. It found 98% were the same price or cheaper at another point in the year, and none was cheapest on Black Friday alone (ITV News).
That study covered large electronics and home retailers, not Shopify brands. Many DTC brands discount rarely, so their BFCM offers tend to be genuine. Inflated "was" prices also break consumer protection rules on reference pricing in the US, UK and EU.
What this means for your store: a 25% discount is not 25% off your profit. On a typical product it can halve the Gross Profit on each order. The discount depth shoppers expect in your category is a benchmark, not a target.
What Shopify BFCM statistics don't show
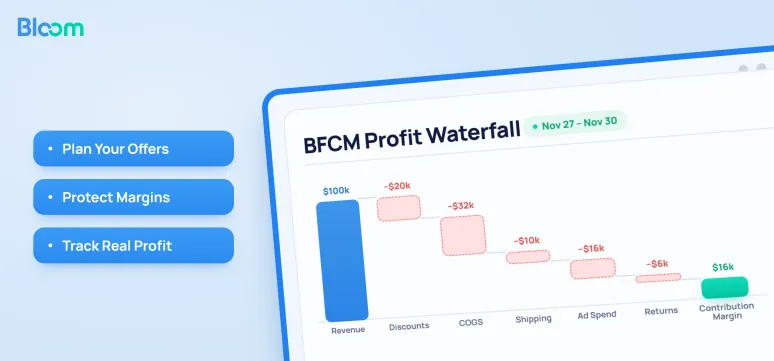
Every number above measures sales. None of them shows how much profit Shopify stores kept after discounts, product costs, shipping, ad spend and returns. For an individual store, that is the number that decides whether BFCM was worth it.
GMV is not profit
| Included in Shopify's BFCM sales (GMV) | Not deducted from it |
|---|---|
| Order value after discounts | Product costs |
| Shipping charged to customers | Fulfillment and shipping costs |
| Duties and taxes | Payment fees |
| Ad spend | |
| Returns that arrive after the report |
GMV is the right measure for the size of the market. It is the wrong measure for the health of your store.
A record sales day is not a record profit day
In 2025, more than 94,900 Shopify merchants had their highest-selling day ever. Nobody reports how many had their most profitable day.
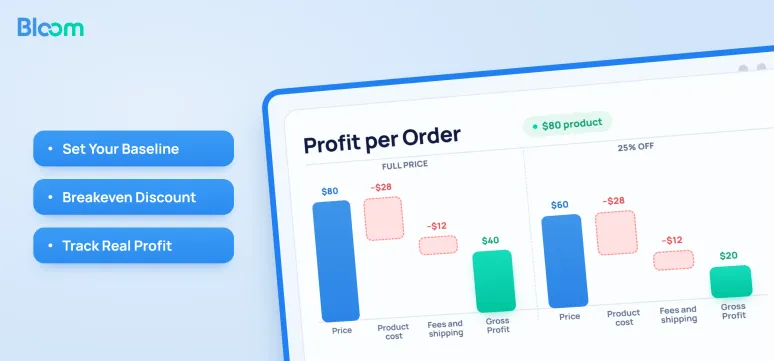
Take a product that sells for $80, with $28 in product cost and $12 in fulfillment and fees. At full price, each order leaves $40 of Gross Profit. At 25% off, it leaves $20. The store needs twice the orders to earn the same Gross Profit, and every ad dollar has to work 50% harder to break even, during the week ad costs usually peak.
That store can double its order count, set a sales record and end BFCM with the same profit as a normal week, or less once returns come in.
Turn market statistics into your own profit benchmarks
Market stats tell you what is normal across Shopify. Your own data tells you whether to join in and how far. Before BFCM, analyze:
- Your normal-week baseline. Orders, average order value, conversion rate and Gross Profit for a typical October week, so you can tell new demand from shifted demand.
- Profit by product. Product Gross Profit and Gross Profit for each product, to decide which ones can take a deep discount and which to protect.
- Your breakeven discount and breakeven ROAS. The deepest discount each product can take and the ad return it needs to stay profitable.
- Last year's BFCM at profit level. Which offers made money, which products came back as returns, and whether BFCM customers bought again at full price.
The step-by-step version is in Shopify Metrics to Track for BFCM. For the full BFCM plan, see the Shopify BFCM guide.
What to expect from Shopify BFCM 2026
Shopify does not publish a BFCM forecast. It reports results within a day of Cyber Monday, and this page will be updated with the 2026 numbers then. The best guide to the wider market is Adobe's forecast for US online retail, published on September 28, 2026 (Adobe).
| Adobe 2026 forecast, US online spend | Amount | Growth vs 2025 |
|---|---|---|
| Thanksgiving, November 26 | $6.9 billion | 8.5% |
| Black Friday, November 27 | $12.9 billion | 9.2% |
| Cyber Monday, November 30 | $15.1 billion | 6.2% |
| Cyber Week total | $47.5 billion | 7.4% |
| Full season, November 1 to December 31 | $275.1 billion | 6.7% |
Five trends from the forecast matter most for Shopify sellers:
- Black Friday keeps gaining on Cyber Monday. It is forecast to grow faster for the third year running, while Cyber Monday stays the biggest single day and is set to be the first online day above $15 billion.
- The season starts earlier. Adobe expects US online spend in October 2026 to rise 8% to $95.8 billion, with discounts of up to 14% in early November and up to 21% before Thanksgiving.
- Discounts peak at up to 30% off list price during Cyber Week, then stay at 10% to 15% through December.
- Shoppers are stocking up on everyday products. Adobe expects Cyber Week sales of clothing basics to run 210% above September levels and personal hygiene products 150% above.
- Mobile keeps growing. A record 63% of Cyber Week online spend is expected to come through phones.
What this means for your store: earlier, longer discounting raises the cost of BFCM for every seller. Starting earlier lets you capture early demand, but every extra discount day also cuts into profit. Decide your offer window from your margins, not from the calendar.
Frequently asked questions
How much did Shopify merchants sell over BFCM 2025?
Shopify merchants sold $14.6 billion over Black Friday Cyber Monday 2025, up 27% from $11.5 billion in 2024. More than 81 million shoppers bought from Shopify stores over the weekend.
How much have Shopify BFCM sales grown compared to last year?
Shopify BFCM sales grew 27% in 2025, after 24% growth in both 2024 and 2023. Sales rose from $9.3 billion in 2023 to $14.6 billion in 2025.
What time do Shopify BFCM sales peak?
Shopify BFCM sales have peaked at 12:01 p.m. EST on Black Friday for three years running. In 2025, the peak reached $5.1 million in sales per minute.
What sells best on Shopify during BFCM?
In 2025, Shopify's top BFCM categories were cosmetics, clothing tops and pants, activewear, and fitness and nutrition. Apparel, beauty and fitness products have led Shopify BFCM since at least 2023.
What is the average order value during Shopify BFCM?
The average Shopify BFCM cart was $114.70 in 2025, up from $108.56 in 2024 and $108.12 in 2023.
When will Shopify release its BFCM 2026 results?
Shopify has published its BFCM results within a day of Cyber Monday in recent years. Cyber Monday 2026 is November 30, so expect the 2026 figures around November 30 to December 1.
Do Shopify BFCM sales numbers show profit?
No. Shopify reports gross merchandise volume, the total value of orders including shipping and taxes. It does not deduct product costs, fulfillment, ad spend or later returns, so a store's profit can fall even when its BFCM sales set a record.